. 2015 Jul 23:5:12475.
doi: 10.1038/srep12475.

Characterization of the honeybee AmNaV1 channel and tools to assess the toxicity of insecticides

Affiliations

Characterization of the honeybee AmNaV1 channel and tools to assess the toxicity of insecticides

Pascal Gosselin-Badaroudine et al. Sci Rep. .

Abstract

Pollination is important for both agriculture and biodiversity. For a significant number of plants, this process is highly, and sometimes exclusively, dependent on the pollination activity of honeybees. The large numbers of honeybee colony losses reported in recent years have been attributed to colony collapse disorder. Various hypotheses, including pesticide overuse, have been suggested to explain the disorder. Using the Xenopus oocytes expression system and two microelectrode voltage-clamp, we report the functional expression and the molecular, biophysical, and pharmacological characterization of the western honeybee's sodium channel (Apis Mellifera NaV1). The NaV1 channel is the primary target for pyrethroid insecticides in insect pests. We further report that the honeybee's channel is also sensitive to permethrin and fenvalerate, respectively type I and type II pyrethroid insecticides. Molecular docking of these insecticides revealed a binding site that is similar to sites previously identified in other insects. We describe in vitro and in silico tools that can be used to test chemical compounds. Our findings could be used to assess the risks that current and next generation pesticides pose to honeybee populations.


Figures
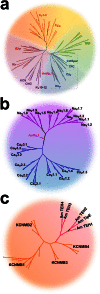
Figure 1
Figure 1. Phylogenetic classification of the AmNaV1 channel and its regulatory subunits.
The minimum pore sequence of the VGL-chanome protein was aligned with the minimum pore sequence of the AmNaV1 channel. (a) Consensus phylogenic tree generated with the maximum likelihood method (using PROML of the PHYLIP package) show that the pore of the AmNaV1 channel diverged in its evolution from the mammalian sodium channels. (b) The tree generated by an alignment of the whole channel with all manually curated sequences of the mammalian sodium and calcium channels shows that the whole sequence diverged early in its evolution. (c) The regulatory subunits of the AmNaV1 channel yielded a significant alignment with KCNMB family members (regulatory subunits of mammalian KCa channels). The resulting tree shows that the TEH family diverged from the KCNMB family members, establishing a family of its own. Based on the protein sequences, the TEH family can be divided in two subfamilies.
Figure 2
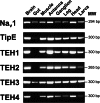
Figure 2. Expression of the AmNaV1 channel and its regulatory subunits in honeybee tissues.
The tissue-specific expression of proteins was assessed by RT-PCR. All the honeybee tissue samples underwent the same preparation steps from dissection to gel electrophoresis. The expected weights of the amplicons are displayed in base pairs (bp).
Figure 3
Figure 3. Effect of the co-expression of the regulatory subunits on the expression of AmNaV1.
(a) Representative current traces from the pulse protocols applied to oocytes expressing either AmNaV1 alone or AmNaV1 and one of its regulatory subunits. The pulse protocols consisted of imposing−80 mV to +40 mV voltage steps in 5 mV increments. The oocytes were kept at the holding potential (−80 mV) for 1 s between voltage steps. (b) Relative amplitudes of the peak currents from oocytes expressing the AmNaV1 alone or with one regulatory subunit. The peak currents from 13–14 oocytes in response to a −80mV to −20 mV voltage step were measured for each bar. The mean was then normalized to the mean current amplitude measured in the presence of the TipE subunit. The differences between the means were then evaluated for statistical significance using a t-test with Bonferroni’s correction (***significant difference with AmNaV1 alone, p < 0.001). The oocytes came from the same batch and were tested the same day. (c) Representative current traces of an oocyte expressing AmNaV1 and TipE in response to a −80 mV to −20 mV voltage step. The current trace in orange was acquired in normal Ringer’s solution while the current trace in black was acquired in Ringer’s solution in which the sodium was replaced by choline.
Figure 4
Figure 4. Effect of the different regulatory subunits on the biophysical properties of AmNaV1.
(a) The voltage-dependence of activation (G–V). Activation curves were derived from I–V curves (n = 7–14). The I–V curves were obtained using the protocol shown in the inset. The peak current measured at each potential was then divided by (V–Vrev), where V is the test potential and Vrev is the reversal potential. The conductances were then normalized and fitted to a standard Boltzmann equation (see Materials and Methods). (b–c) Plots of the fitted equation activation parameters (V1/2 and kv). Statistical differences were tested using a one-way ANOVA with Bonferroni’s correction. (d) The voltage-dependence of steady-state inactivation. The amplitude of the peak current was plotted as a function of the voltage imposed during the conditioning pulse (n = 8–14) using the protocol in the inset. The data was then fitted to a Boltzmann equation (see Materials and Methods). (e–f) Plots of the inactivation parameters (V1/2 and kv) of the fitted equation. Statistical differences were tested using a one-way ANOVA with Bonferroni’s correction. (g) Time constants of current decay. The protocol in (a) was used to generate transient sodium currents at different voltages. The decay of the transient current was fitted with a single exponential. For each condition, the time constant extracted from the fit was plotted as a function of the voltage imposed (n = 7–14). Typical raw data obtained as a result of a depolarization to −20 mV is shown in the inset to illustrate the different decay kinetics. (h) Recovery from inactivation. The amplitude of the peak current measured during the second pulse was divided by the amplitude measured during the first pulse and was then plotted against the time interval between the pulses (n = 8–14) using the protocol in the inset. (i) The resulting curves were fitted with a single exponential in order to compare the time constants. A statistical analysis using one-way ANOVA with Bonferroni’s correction was performed to assess significant differences between the oocytes expressing regulatory subunits and oocytes expressing AmNaV1 alone. *p < 0.05, and ** and ***p < 0.01 and 0.001.
Figure 5
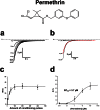
Figure 5. Effect of permethrin on the honeybee NaV1 channel.
(ac) The presence of 10 μM permethrin had no significant effect on the voltage-dependence of activation (a), the voltage-dependence of steady-state inactivation (b), or the recovery from inactivation (c) of AmNaV1 channels co-expressed with TipE. It did, however, induce a tail current. The maximal amplitude of the tail current after 200 conditioning pulses was recorded at different voltages (d). The normalized amplitude was plotted as a function of the voltage imposed during the recording (n = 9). The data was then fitted with a linear function (R2 = 0.98, y0 = −8.4%, slope = 1.0%/V).
Figure 6
Figure 6. Permethrin induced tail currents in oocytes expressing AmNaV1.
The presence of 10 μM permethrin induced tail currents in oocytes co-expressing the AmNaV1 channel and the TipE regulatory subunit. (a) The amplitude of the tail current was highly dependent on the number of depolarizations imposed before the recording (pulses from −80 mV to −20 mV repeated at a frequency of 100 Hz). (b) The amplitude of the tail current was also dependent on the concentration of permethrin in the extracellular medium. The red dotted line represents the fit of the tail current at 10 μM. (c) The number of conditioning pulses (CP) required to attain the maximal amplitude of the tail current in the presence of 10 μM permethrin was then determined (n = 4). (d) The fraction of channels modified by permethrin (M) was calculated using equation 1 in the supplemental methods and plotted as a function of the dose applied using 200 conditioning pulses. The data was then fitted with a Hill curve in order to extract the Hill coefficient (h = 0.83) and the half maximal effective concentration (EC50 = 3.7 μM). The error bars represent the SEM.
Figure 7
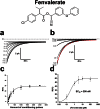
Figure 7. Fenvalerate induced tail currents in oocytes expressing AmNaV1.
The presence of 10 μM fenvalerate induced a tail current in oocytes co-expressing AmNaV1 and its TipE regulatory subunit. (a) The amplitude of the tail current was highly dependent on the number of depolarizations imposed before the recording (pulses from −80 mV to −20 mV repeated at a frequency of 100 Hz). (b) The amplitude of the tail current was also dependent on the concentration of fenvalerate in the extracellular medium. The red dotted line represents the fit of the tail current at 10 μM. (c) The number of conditioning pulses (CP) required to attain the maximal amplitude of the tail current in the presence of 10 μM fenvalerate was then determined (n = 3). (d) The fraction of channels modified by fenvalerate (M) was calculated using equation 1 in the supplemental methods and plotted as a function of the dose applied using 1700 conditioning pulses. The data was then fitted with a Hill curve in order to extract the Hill coefficient (h = 1.18) and the half maximal effective concentration (EC50 = 290 nM). The error bars represent the SEM.
Figure 8
Figure 8. Structural model and docking poses AmNaV1.
(a) Top view of one of the poses used for the docking calculations. The protein is in grey with the exception of the first domain, which is in blue. The residues involved in the binding site mapped by Du et al. in the A. aegypti channel are in purple. (b) A close-up view of the pore from the top, with the most populated docking pose for TTX. The most populated docking pose for TTX is in orange. The α-carbon of the residues involved in the DEKA motif of the selectivity filter are in green (D386, E989, K1496 and A1789). The residues located within 4.5 Å of the toxin which are known to contribute to TTX binding in mammalian sodium channels are displayed in yellow (Y387, W388, E389, G988, G1497 and D1792). The α-carbon of other residues known to contribute to TTX binding in mammalian sodium channels according to the model published by Tikhonov and Zhorov but not located within 4.5 Å of the TTX cluster are displayed in red (W990, E992, W1498, Q1500 and W1791). The α-carbon of the residues located within 4.5 Å of the TTX cluster but not considered to play a major role in TTX binding according to Tikhonov and Zhorov are shown in orange (D386, Y387, E389 E989, K1496, A1789 and D1792). (c) The most populated docking poses for permethrin are shown on a side view of the protein. (d) The most populated docking poses for fenvalerate are shown in the same view. The residues in purple in c and d are the residues involved in the binding site mapped by Du et al.

Similar articles

Cited by

References

    1. Morse R. A. & Calderone N. W. The value of honey bees as pollinators of U.S. crops in 2000. Bee Culture 128, 1–15 (2000).
    1. Gallai N., Salles J.-M., Settele J. & Vaissière B. E. Economic valuation of the vulnerability of world agriculture confronted with pollinator decline. Ecol. Econ. 68, 810–821 (2009).
    1. Van Engelsdorp D., Hayes J., Underwood R. M. & Pettis J. A survey of honey bee colony losses in the U.S., fall 2007 to spring 2008. PloS one 3, e4071–e4071, 10.1371/journal.pone.0004071 (2008). - DOI - PMC - PubMed
    1. Carreck N. & Neumann P. Honey bee colony losses. J. Apicult. Res. 49, 1–1, 10.3896/IBRA.1.49.1.01 (2010). - DOI
    1. Oldroyd B. P. What’s killing American honey bees? PLoS Biol. 5, e168–e168, 10.1371/journal.pbio.0050168 (2007). - DOI - PMC - PubMed

Publication types

MeSH terms

LinkOut - more resources