. 2015 Dec;40(12):2473-81.
doi: 10.1007/s11064-015-1664-4. Epub 2015 Jul 23.

Revisiting Glycogen Content in the Human Brain

Affiliations

Revisiting Glycogen Content in the Human Brain

Gülin Öz et al. Neurochem Res. 2015 Dec.

Abstract

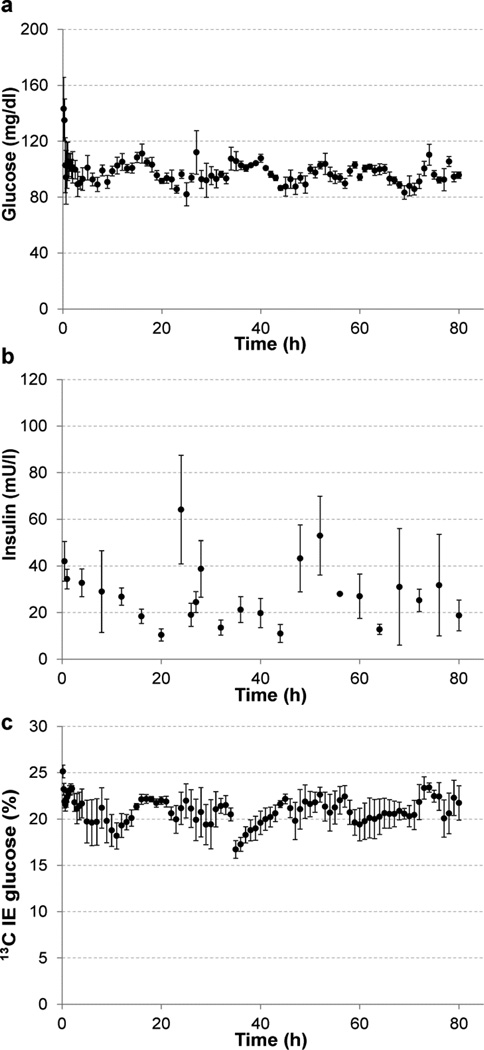
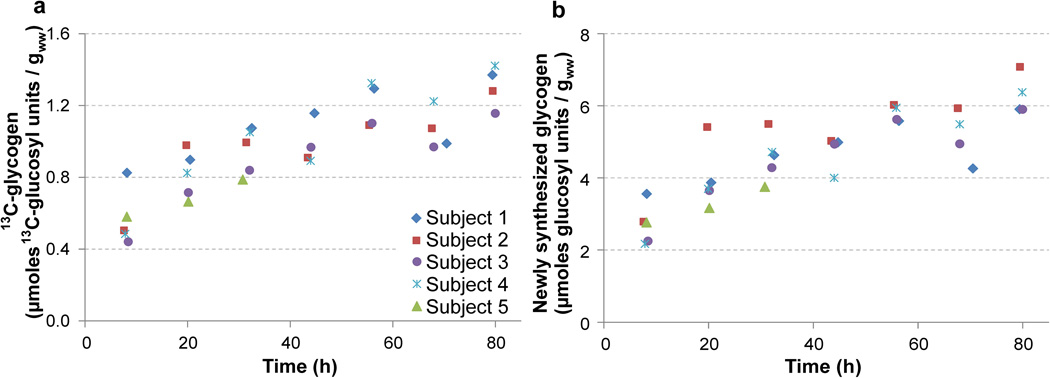
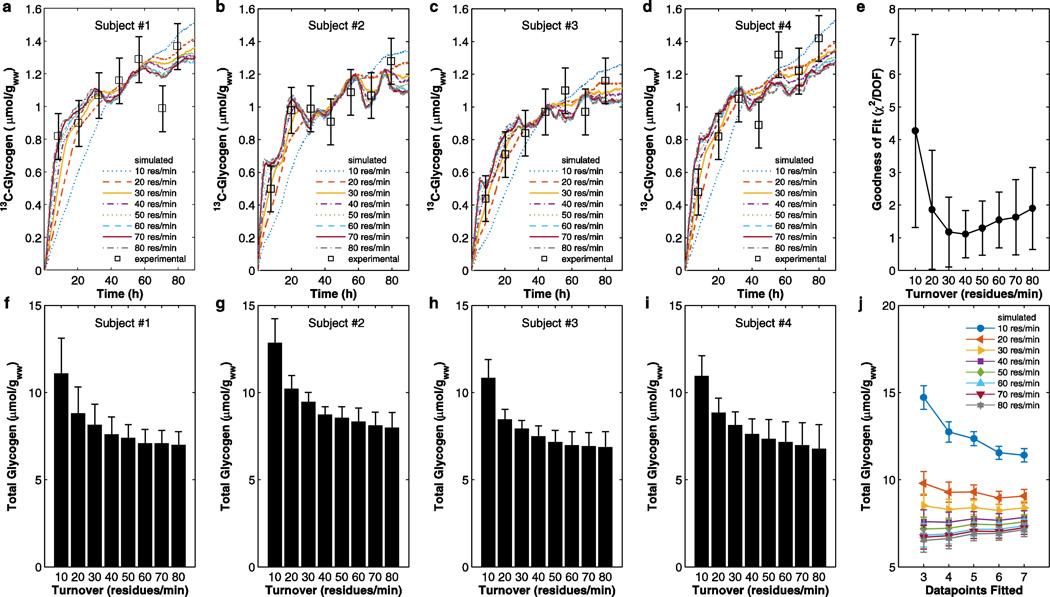
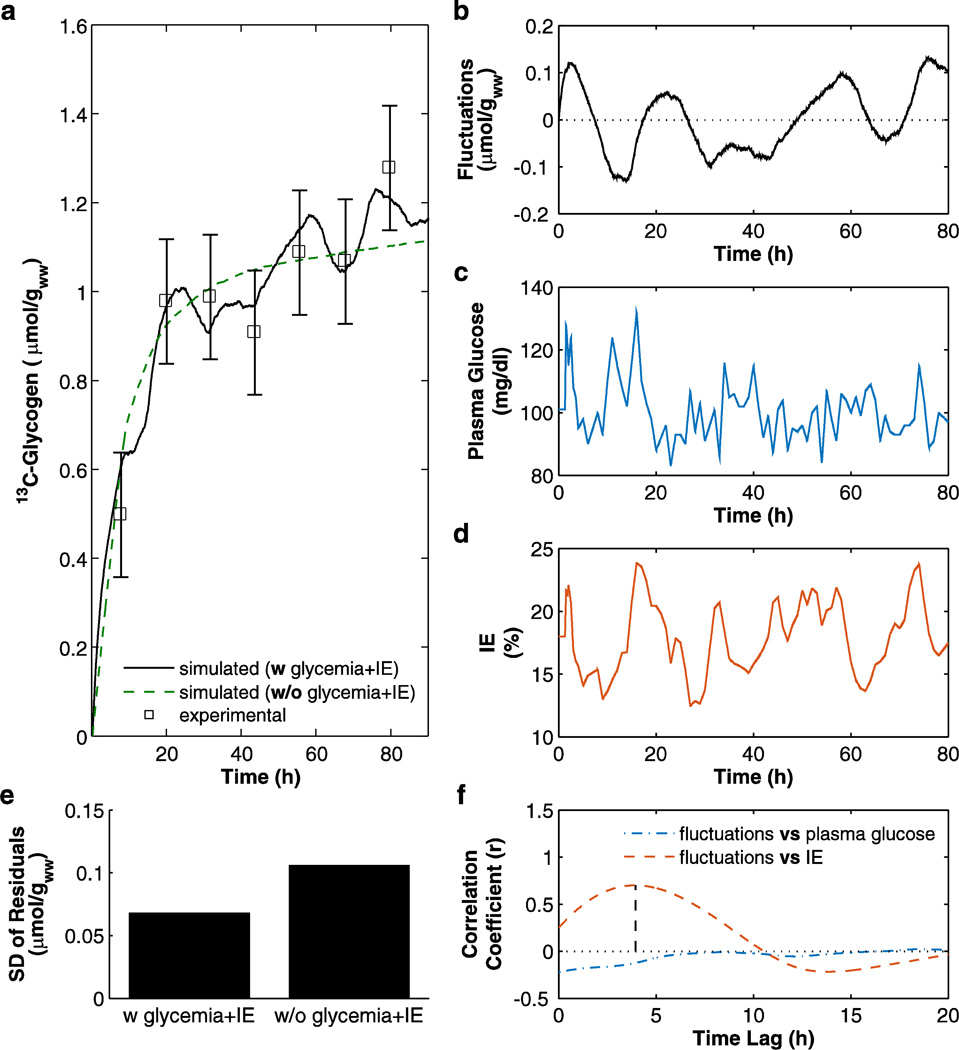
Glycogen provides an important glucose reservoir in the brain since the concentration of glucosyl units stored in glycogen is several fold higher than free glucose available in brain tissue. We have previously reported 3-4 µmol/g brain glycogen content using in vivo (13)C magnetic resonance spectroscopy (MRS) in conjunction with [1-(13)C]glucose administration in healthy humans, while higher levels were reported in the rodent brain. Due to the slow turnover of bulk brain glycogen in humans, complete turnover of the glycogen pool, estimated to take 3-5 days, was not observed in these prior studies. In an attempt to reach complete turnover and thereby steady state (13)C labeling in glycogen, here we administered [1-(13)C]glucose to healthy volunteers for 80 h. To eliminate any net glycogen synthesis during this period and thereby achieve an accurate estimate of glycogen concentration, volunteers were maintained at euglycemic blood glucose levels during [1-(13)C]glucose administration and (13)C-glycogen levels in the occipital lobe were measured by (13)C MRS approximately every 12 h. Finally, we fitted the data with a biophysical model that was recently developed to take into account the tiered structure of the glycogen molecule and additionally incorporated blood glucose levels and isotopic enrichments as input function in the model. We obtained excellent fits of the model to the (13)C-glycogen data, and glycogen content in the healthy human brain tissue was found to be 7.8 ± 0.3 µmol/g, a value substantially higher than previous estimates of glycogen content in the human brain.

Keywords: 13C magnetic resonance spectroscopy; Glycogen; Human brain; Mathematical modeling.


Figures

Figure 1
Figure 1
Time courses of average (± SEM) plasma glucose (a), serum insulin (b) and plasma 13C isotopic enrichment (IE) (c) levels during IV infusions of [1-13C]glucose in 5 healthy volunteers (4 subjects received infusion for ~80 hours and the fifth subject received infusion for 29 hours). For glucose concentrations, 80 mg/dl = 4.4 mmol/l, 100 mg/dl = 5.6 mmol/l, 120 mg/dl = 6.7 mmol/l.
Figure 2
Figure 2
13C-labeled glycogen (a) and newly synthesized glycogen (b) concentrations in all volunteers. Newly synthesized glycogen levels are obtained by dividing the [1-13C]glycogen concentrations by the mean plasma glucose IE of each volunteer. Note that because of the slow turnover of core glycogen the total glycogen content is higher than newly synthesized glycogen.
Figure 3
Figure 3
Quantification of total glycogen content in the human brain from experimental measurements and simulated time-courses of 13C-glycogen concentration during 80 hour long infusions in 4 healthy subjects. (a–d) Least-square fitting between experimental data and molecular-level simulations at different turnover rates. The error bars on experimental data have been estimated at 0.15 µmol/g. Molecular turnover rates of 10–20 residues per minute are found to be too slow for 13C-glycogen to follow changes in plasma glucose and IE, whereas higher turnover rates result in larger fluctuations of simulated data. (e) Statistical χ2 goodness-of-fit test. Across-subjects averages (mean ± SD) of reduced χ2 as a function of molecular turnover. The best outcome is obtained for a turnover of 40 residues per minute, as evidenced by the value around unity of the reduced χ2 (i.e. taking into account the degrees of freedom, DOF) and associated error. (f–i) Estimates of total brain glycogen as a function of molecular turnover, obtained by rescaling the fraction (i.e. labeled/total) of molecular-level label incorporation to the 13C-glycogen concentration after the least-square fitting. Note that such scaling is possible because the structural model accounts for the portion of the molecule that does not undergo turnover. The estimate decreases at increasing molecular turnover rates and converges at a plateau for turnover greater than 50–60 residues per minute. The error in the estimate was calculated as the SD of the residuals (differences between experimental and simulated values). Note the smallest error in the estimate is obtained with a molecular turnover of 40 residues per minute. (j) Dependence of the estimate of total glycogen content upon the length of the experiment, i.e. the number of experimental data points used for modeling. The effect of experimental duration is substantial for molecular turnover rates of 10–20 residues per minute and less so for the highest simulated values of molecular turnover (60–80 residues per minute). For intermediate values of molecular turnover (30–50 residues per minute) the effect of data points fitted on the estimate of total glycogen is negligible.
Figure 4
Figure 4
Final simulation in one volunteer (subject #2) with molecular turnover rate of 40 residues per minute to demonstrate how the simulation is able to track the 13C-glycogen levels. (a) Least square fitting between experimental measurements and data simulated either with or without the incorporation of plasma glucose (glycemia) and IE as additional inputs to the model. (b) Fluctuations of 13C-glycogen obtained by subtracting the two time courses (shown in a) simulated with time-dependent or constant glycemia and IE. (c–d) Experimentally measured physiological parameters used as input functions to the model. (e) Incorporation of physiological parameters results in better fit, as evidenced by the smaller standard deviation of residuals (difference between experimental and simulated data). (f) Cross-correlation between 13C-glycogen fluctuations and physiological parameters. IE shows a delayed, positive correlation with the simulated 13C-glycogen time-course, while changes in plasma glucose in the range utilized here do not affect 13C-glycogen levels.
Figure 5
Figure 5
Simulated data for turned over and 13C-labeled glycogen at the end of an 80 hour 13C-glucose administration. (a, b) Pictorial representations of mature glycogen molecules with highlighted turned over glucosyl residues (shown in blue in a) and 13C-labeled residues (shown in maroon in b), and corresponding quantification (c). Simulations were obtained using a molecular turnover rate of 40 residues per minute. IE was set to 21% in the labeling simulation. During the 80 hour infusion period, nearly 68% of glycogen has been turned over, while label retention was 13%. Note that these simulations were performed by assuming constant plasma glucose and IE.

References

    1. Wiesinger H, Hamprecht B, Dringen R. Metabolic pathways for glucose in astrocytes. Glia. 1997;21(1):22–34. - PubMed
    1. Wender R, Brown AM, Fern R, Swanson RA, Farrell K, Ransom BR. Astrocytic glycogen influences axon function and survival during glucose deprivation in central white matter. J Neurosci. 2000;20(18):6804–6810. - PMC - PubMed
    1. Swanson RA, Choi DW. Glial glycogen stores affect neuronal survival during glucose deprivation in vitro. J Cereb Blood Flow Metab. 1993;13(1):162–169. - PubMed
    1. Swanson RA. Physiologic coupling of glial glycogen metabolism to neuronal activity in brain. Can J Physiol Pharmacol. 1992;70(Suppl):S138–S144. - PubMed
    1. Brown AM. Brain glycogen re-awakened. J Neurochem. 2004;89(3):537–552. - PubMed

Publication types

LinkOut - more resources