

Real-time measurement of hyperpolarized lactate production and efflux as a biomarker of tumor aggressiveness in an MR compatible 3D cell culture bioreactor
- PMID: 26202449
- PMCID: PMC4537810
- DOI: 10.1002/nbm.3354
Real-time measurement of hyperpolarized lactate production and efflux as a biomarker of tumor aggressiveness in an MR compatible 3D cell culture bioreactor
Abstract
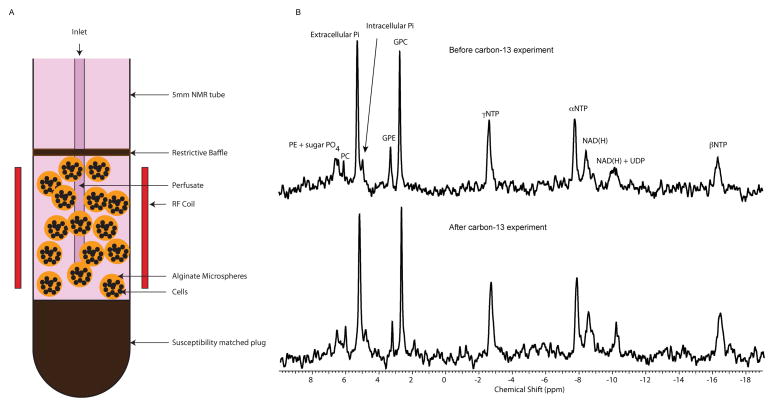
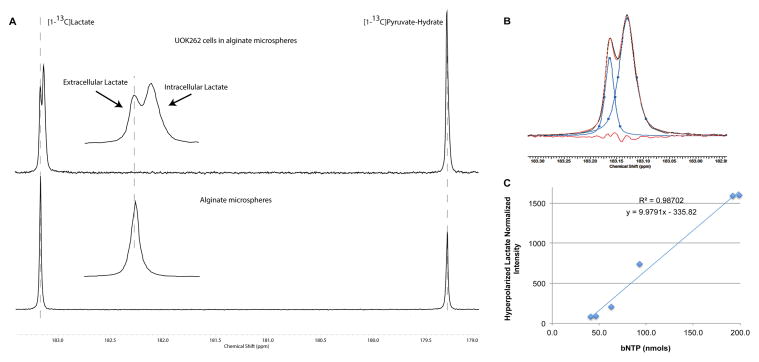
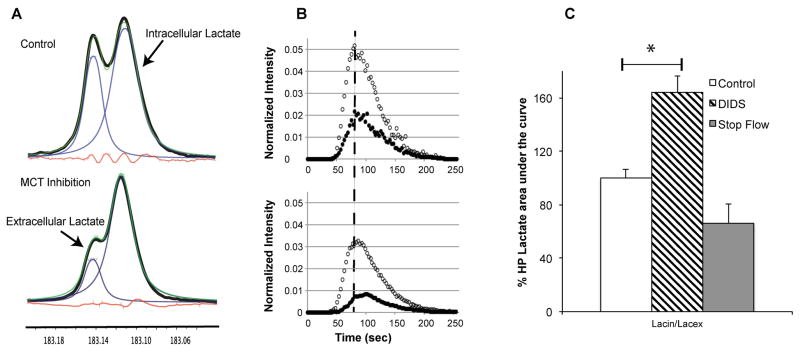
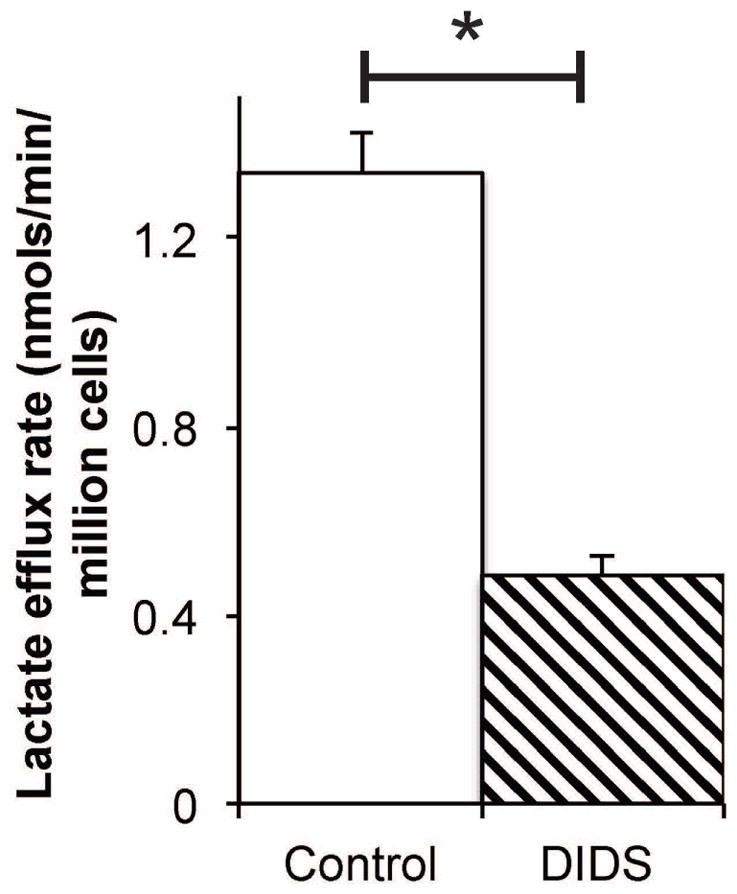
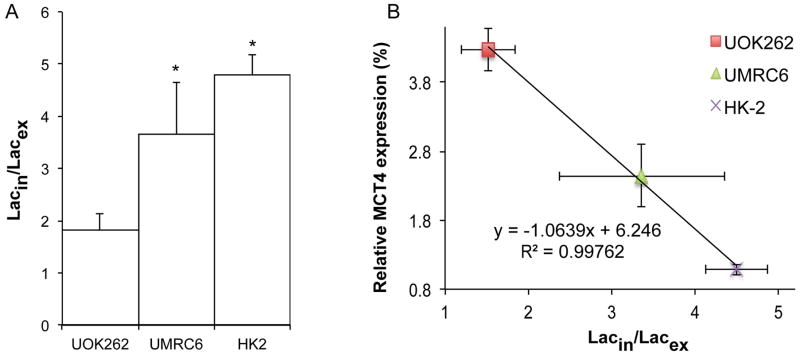
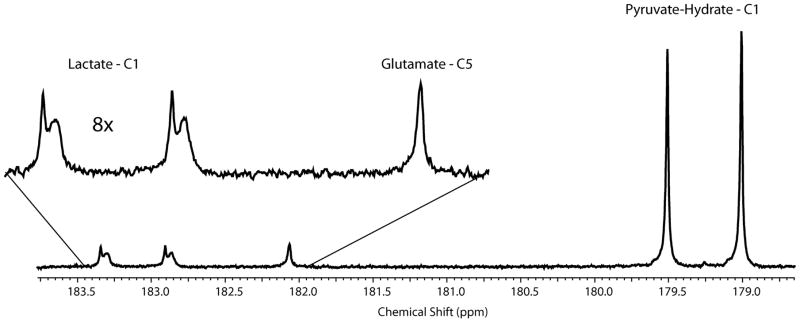
We have developed a 3D cell/tissue culture bioreactor compatible with hyperpolarized (HP) (13)C MR and interrogated HP [1-(13)C]lactate production and efflux in human renal cell carcinoma (RCC) cells. This platform is capable of resolving intracellular and extracellular HP lactate pools, allowing the kinetic measurement of lactate production and efflux in the context of cancer aggressiveness and response to therapy. HP (13)C MR studies were performed on three immortalized human renal cell lines: HK2, a normal renal proximal tubule cell line from which a majority of RCCs arise, UMRC6, a cell line derived from a localized RCC, and UOK262, an aggressive and metastatic RCC. The intra- (Lacin ) and extracellular (Lacex ) HP lactate signals were robustly resolved in dynamic (13)C spectra of the cell lines due to a very small but reproducible chemical shift difference (0.031 ± 0.0005 ppm). Following HP [1-(13)C]pyruvate delivery, the ratio of HP Lacin /Lacex was significantly lower for UOK262 cells compared with both UMRC6 and HK2 cells due to a significant (p < 0.05) increase in the Lacex pool size. Lacin /Lacex correlated with the MCT4 mRNA expression of the cell lines, and inhibition of MCT4 transport using DIDS resulted in a significant reduction in the HP Lacex pool size. The extension of these studies to living patient-derived RCC tissue slices using HP [1,2-(13)C2]pyruvate demonstrated a similarly split lactate doublet with a high Lacex pool fraction; in contrast, only a single NMR resonance is noted for HP [5-(13)C]glutamate, consistent with intracellular localization. These studies support the importance of lactate efflux as a biomarker of cancer aggressiveness and metastatic potential, and the utility of the MR compatible 3D cell/tissue culture bioreactor to study not only cellular metabolism but also transport. Additionally, this platform offers a sophisticated way to follow therapeutic interventions and screen novel therapies that target lactate export.
Keywords: aerobic glycolysis; cancer aggressiveness; dynamic nuclear polarization (DNP); hyperpolarized 13C magnetic resonance (HP 13C MR); lactate; lactate efflux; pyruvate; renal cell carcinoma (RCC).
Copyright © 2015 John Wiley & Sons, Ltd.
Figures
Similar articles
-
Modeling hyperpolarized lactate signal dynamics in cells, patient-derived tissue slice cultures and murine models.NMR Biomed. 2021 Mar;34(3):e4467. doi: 10.1002/nbm.4467. Epub 2021 Jan 7. NMR Biomed. 2021. PMID: 33415771 Free PMC article.
-
Hyperpolarized 13C-pyruvate magnetic resonance reveals rapid lactate export in metastatic renal cell carcinomas.Cancer Res. 2013 Jan 15;73(2):529-38. doi: 10.1158/0008-5472.CAN-12-3461. Epub 2012 Nov 30. Cancer Res. 2013. PMID: 23204238 Free PMC article.
-
Non-Invasive Assessment of Lactate Production and Compartmentalization in Renal Cell Carcinomas Using Hyperpolarized 13C Pyruvate MRI.Cancers (Basel). 2018 Sep 5;10(9):313. doi: 10.3390/cancers10090313. Cancers (Basel). 2018. PMID: 30189677 Free PMC article.
-
Imaging pH with hyperpolarized 13C.NMR Biomed. 2011 Oct;24(8):1006-15. doi: 10.1002/nbm.1742. Epub 2011 Aug 3. NMR Biomed. 2011. PMID: 21812047 Review.
-
Magnetic resonance imaging as a biomarker in renal cell carcinoma.Cancer. 2009 May 15;115(10 Suppl):2334-45. doi: 10.1002/cncr.24237. Cancer. 2009. PMID: 19402070 Review.
Cited by
-
Hyperpolarized (13)C MR imaging detects no lactate production in mutant IDH1 gliomas: Implications for diagnosis and response monitoring.Neuroimage Clin. 2016 Jun 23;12:180-9. doi: 10.1016/j.nicl.2016.06.018. eCollection 2016. Neuroimage Clin. 2016. PMID: 27437179 Free PMC article.
-
Specialized computational methods for denoising, B1 correction, and kinetic modeling in hyperpolarized 13 C MR EPSI studies of liver tumors.Magn Reson Med. 2021 Nov;86(5):2402-2411. doi: 10.1002/mrm.28901. Epub 2021 Jul 3. Magn Reson Med. 2021. PMID: 34216051 Free PMC article.
-
Hyperpolarized Dihydroxyacetone Is a Sensitive Probe of Hepatic Gluconeogenic State.Metabolites. 2021 Jul 5;11(7):441. doi: 10.3390/metabo11070441. Metabolites. 2021. PMID: 34357335 Free PMC article.
-
Hyperpolarized 13C MRI: Path to Clinical Translation in Oncology.Neoplasia. 2019 Jan;21(1):1-16. doi: 10.1016/j.neo.2018.09.006. Epub 2018 Nov 23. Neoplasia. 2019. PMID: 30472500 Free PMC article. Review.
-
Detection of Bacteria-Specific Metabolism Using Hyperpolarized [2-13C]Pyruvate.ACS Infect Dis. 2018 May 11;4(5):797-805. doi: 10.1021/acsinfecdis.7b00234. Epub 2018 Feb 13. ACS Infect Dis. 2018. PMID: 29405697 Free PMC article.
References
-
- Hirschhaeuser F, Sattler UGA, Mueller-Klieser W. Lactate: a metabolic key player in cancer. Cancer Research. 2011;71:6921–6925. - PubMed
-
- Feron O. Pyruvate into lactate and back: from the Warburg effect to symbiotic energy fuel exchange in cancer cells. Radiother Oncol. 2009;92:329–333. - PubMed
-
- Parks SK, Chiche J, Pouysségur J. Disrupting proton dynamics and energy metabolism for cancer therapy. Nat Rev Cancer Nature Publishing Group. 2013;13:611–623. - PubMed
-
- Gatenby RA, Gawlinski ET, Gmitro AF, Kaylor B, Gillies RJ. Acid-mediated tumor invasion: a multidisciplinary study. Cancer Research. 2006;66:5216–5223. 2006 ed. - PubMed
Publication types
MeSH terms
Substances
Grants and funding
LinkOut - more resources
Full Text Sources
Other Literature Sources
Medical
Research Materials
Miscellaneous
