. 2015 Sep 15;26(18):3263-74.
doi: 10.1091/mbc.E15-01-0058. Epub 2015 Jul 22.

TPC2 mediates new mechanisms of platelet dense granule membrane dynamics through regulation of Ca2+ release

Affiliations

TPC2 mediates new mechanisms of platelet dense granule membrane dynamics through regulation of Ca2+ release

Andrea L Ambrosio et al. Mol Biol Cell. .

Abstract

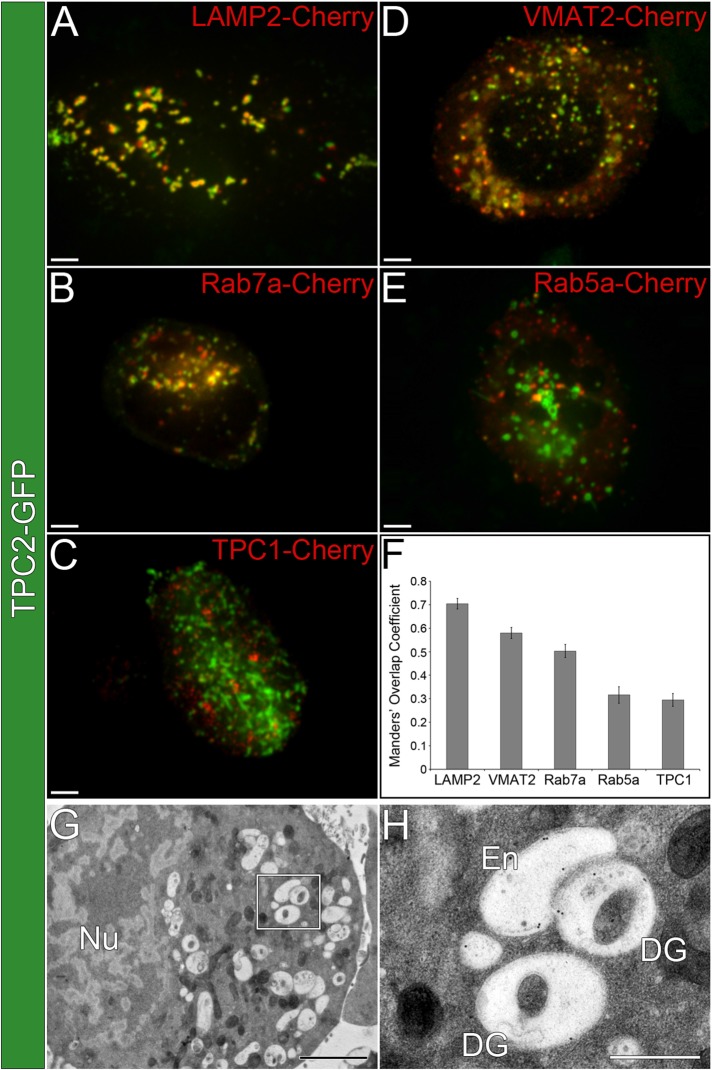
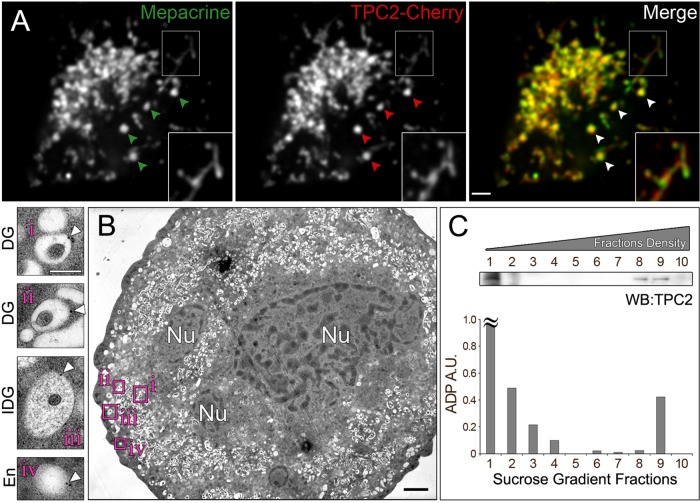
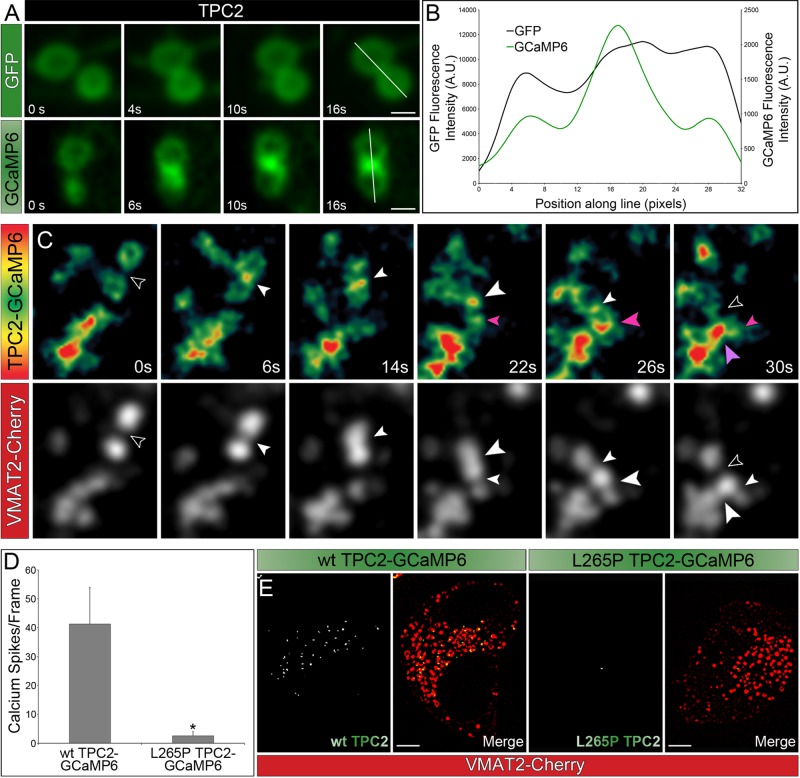
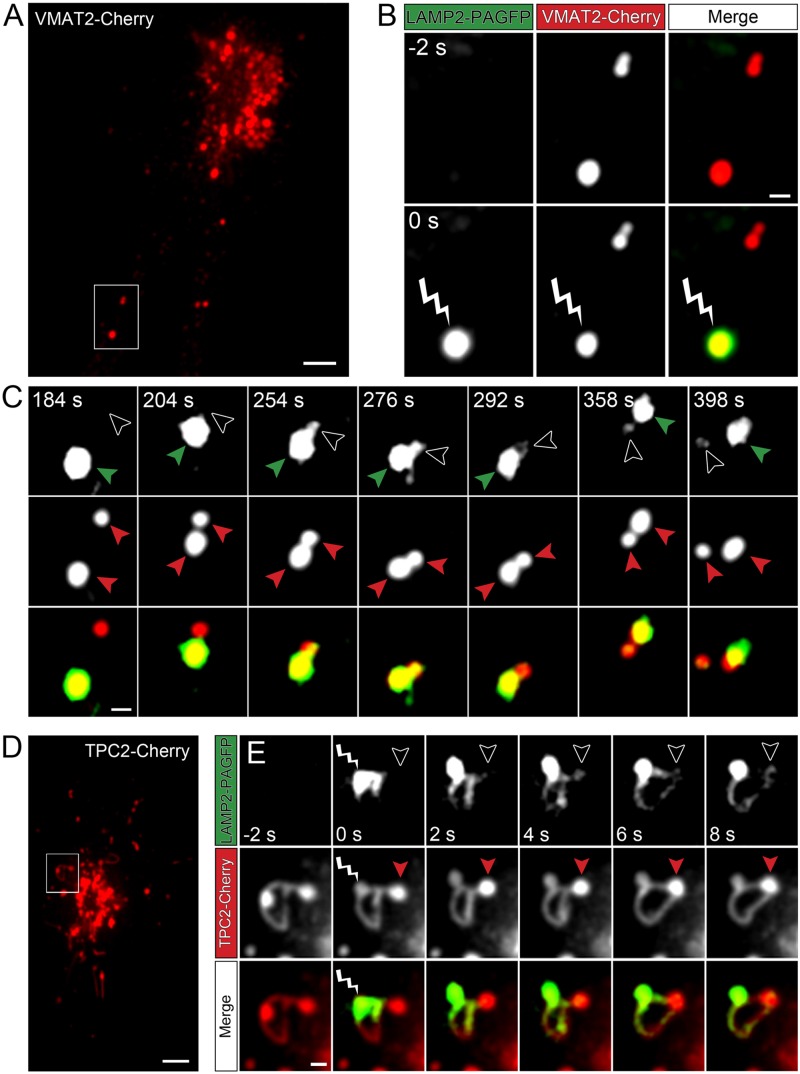
Platelet dense granules (PDGs) are acidic calcium stores essential for normal hemostasis. They develop from late endosomal compartments upon receiving PDG-specific proteins through vesicular trafficking, but their maturation process is not well understood. Here we show that two-pore channel 2 (TPC2) is a component of the PDG membrane that regulates PDG luminal pH and the pool of releasable Ca(2+). Using a genetically encoded Ca(2+) biosensor and a pore mutant TPC2, we establish the function of TPC2 in Ca(2+) release from PDGs and the formation of perigranular Ca(2+) nanodomains. For the first time, Ca(2+) spikes around PDGs--or any organelle of the endolysosome family--are visualized in real time and revealed to precisely mark organelle "kiss-and-run" events. Further, the presence of membranous tubules transiently connecting PDGs is revealed and shown to be dramatically enhanced by TPC2 in a mechanism that requires ion flux through TPC2. "Kiss-and-run" events and tubule connections mediate transfer of membrane proteins and luminal content between PDGs. The results show that PDGs use previously unknown mechanisms of membrane dynamics and content exchange that are regulated by TPC2.


Figures

FIGURE 1:
FIGURE 1:
TPC2 localizes to PDGs in MEG-01 cells. (A–E) Spinning-disk confocal fluorescence microscopy images of live MEG-01 cells coexpressing TPC2-GFP and (A) LAMP2-Cherry, (B) Rab7a-Cherry, (C) TPC1-Cherry, (D) VMAT2-Cherry, and (E) Rab5a-Cherry. Bars, 5 μm. (F) MOCs were determined for the colocalization between TPC2-GFP and the Cherry-tagged markers described for A–E (n ≥ 10 cells/treatment). (G) Thin-section immunogold electron micrograph of a MEG-01 cell expressing TPC2-GFP and labeled with an anti-GFP antibody (2200×). Bar, 2 μm. See also Supplemental Figure S1. (H) Higher-magnification view from the region indicated in G showing examples of mature PDGs (DG) and endosomes (En; 8900×). Bar, 500 nm.
FIGURE 2:
FIGURE 2:
TPC2 localizes to PDGs in primary MKs. (A) Spinning-disk confocal fluorescence microscopy images of a live primary bone marrow MK expressing TPC2-Cherry and incubated with the PDG-specific green fluorescent dye mepacrine. Bar, 5 μm. Inset, magnified view of the indicated region showing PDGs connected by tubules. (B) Thin-section immunogold electron micrograph of a primary MK labeled with the chicken TPC2-C antibody (7000×). Insets (15,000×), examples of mature PDGs (i, ii), immature PDG (iii), and endosome (iv). White arrowheads indicate gold particles. Black bar, 2 μm; white bar, 250 nm. Nu, nucleus. See also Supplemental Figure S3. (C) Subcellular fractionation of primary MKs. The postnuclear supernatant of a primary MK extract was subjected to a 10–60% linear sucrose gradient fractionation. Fractions obtained were analyzed for their ADP content and immunoblotting with a rabbit anti-TPC2 antibody. ≈, out of scale.
FIGURE 3:
FIGURE 3:
TPC2 overexpression alkalizes the lumen of PDGs. (A) Localization of fluorescent tags in PDG proteins. (B, C) Live MEG-01 cells expressing tf-LAMP2 alone or in combination with either wt TPC2-iRFP or the pore mutant L265P TPC2-iRFP were analyzed by spinning-disk confocal fluorescence microscopy. (B) The ratio between red and green fluorescence intensity as a measure of luminal pH was calculated for each treatment (n ≥ 56 cells/treatment). A lower red/green fluorescence intensity ratio corresponds to higher pH. (C) Confocal fluorescence microscopy images of representative examples. Bar, 5 μm. iRFP, infrared fluorescent protein.
FIGURE 4:
FIGURE 4:
TPC2 knockdown or pharmacological inhibition acidify the lumen of PDGs. (A, B) MEG-01 cells expressing mNectarine-LAMP2 alone or in combination with wt TPC2-GFP and either an irrelevant siRNA (–) or two independent TPC2 siRNAs (the same siRNAs used in Supplemental Figure S2) were analyzed by spinning-disk confocal fluorescence microscopy. (A) The average mNectarine-LAMP2 fluorescence intensity was calculated for each treatment (n ≥ 60 cells/treatment). For statistical analysis, all gray bars were compared against the mNectarine-LAMP2 black bar. A higher mNectarine fluorescence intensity corresponds to higher pH. (B) Representative examples. Bar, 5 μm. (C, D) MEG-01 cells expressing mNectarine-LAMP2 were subjected to PDG loading with the cell-impermeant green fluorescent Ca2+ indicator Fluo3, followed by a 4-h chase period. Cells were subsequently treated with Ned19 to block Ca2+ release from PDGs or vehicle (dimethyl sulfoxide). (C) Spinning-disk confocal fluorescence microscopy images of representative examples. Bar, 5 μm. (D) The average fluorescence intensity of Fluo3 and mNectarine-LAMP2 was calculated for each treatment as measure of relative PDG luminal free [Ca2+] and pH, respectively (n ≥ 59 cells/treatment).
FIGURE 5:
FIGURE 5:
TPC2 mediates the formation of perigranular Ca2+ nanodomains. (A) Spinning-disk confocal fluorescence microscopy images at different time points of live MEG-01 cells expressing TPC2 tagged with either GFP or GCaMP6. Bar, 1 μm. (B) Fluorescence intensity line scans of the PDGs shown in A. (C) Spinning-disk confocal fluorescence microscopy images at different time points of MEG-01 cells coexpressing TPC2-GCaMP6 and VMAT2-Cherry. Top, heat maps based on the fluorescence intensity of TPC2-GCaMP6; bottom, the VMAT2-Cherry channel. Open arrowheads indicate no contact between PDGs. All other arrowheads indicate contact between PDGs; color and size of the arrowheads are used to compare contacts among different organelles. At time 0 s, the black arrowhead indicated the space between two PDGs that were not yet making contact (VMAT2-Cherry, bottom), and the TPC2-GCaMP6 heat map showed homogeneous fluorescence intensity around the organelles (top). Once these PDGs touched each other, a sustained Ca2+ spike was observed in the contact region (6–26 s, white arrowheads), which dissipated only when the PDGs moved away from each other (30 s, black arrowhead). At 22 s, another PDG was observed approaching and making contact with the mentioned pair and triggering a small Ca2+ spike (small pink arrow) that gained more intensity as the organelles got closer together (26 s, large pink arrow). Finally, the newly formed pair made contact with another granule, eliciting a large Ca2+ release (30 s, large purple arrow). (D, E) MEG-01 cells expressing wt TPC2-GCaMP6 or L265P TPC2-GCaMP6 and VMAT2-Cherry were analyzed. Ca2+ spikes were defined in Laplacian two-dimensional (2D) filtered confocal images as regions with GCaMP6 fluorescence intensity at least 1.02 times higher than background green fluorescence. (D) The average number of Ca2+ spikes per frame was calculated for wt and pore mutant TPC2 transfected cells. At least 30 frames/cell and 5 cells were used for each construct. (E) Laplacian 2D filtered confocal images of representative cells. Bar, 5 μm. See also Supplemental Figure S8.
FIGURE 6:
FIGURE 6:
TPC2 promotes the formation of tubule connections between PDGs. (A) Spinning-disk confocal fluorescence microscopy image of a representative MEG-01 cell expressing wt TPC2-GCaMP6 and VMAT2-Cherry. Insets, magnified view of a TPC2- and VMAT2-labeled tubule. White arrowheads indicate Ca2+ spikes revealed by TPC2-GCaMP6 (intensity fluorescence map) that in most cases are intercalated between vesicles (VMAT2-Cherry image). Bar, 5 μm. (B) PDGs in a live MEG-01 cell expressing TPC2-cherry were loaded with the fluid- phase marker dextran–Alexa Fluor 488. Spinning-disk confocal fluorescence microscopy allows visualization of TPC2-labeled tubules. Insets show the presence of both dextran–Alexa Fluor 488 (green arrowheads) and TPC2-Cherry (red arrowheads) in the tubules. Bar, 5 μm. (C) The average percentage of cells with tubules was calculated for wt or L265P TPC2–expressing cells in two independent experiments.
FIGURE 7:
FIGURE 7:
“Kiss-and-run” events and tubule connections mediate transfer of membrane proteins between PDGs. (A) MEG-01 cells expressing VMAT2-Cherry and LAMP2-PGFP were analyzed by spinning-disk confocal fluorescence microscopy. A frame of the video 2 s before photoactivation of a selected PDG. The highlighted area shows two PDGs, one of which is subsequently photoactivated. Bar, 5 μm. (B) Magnified view of the area highlighted in A shown 2 s before (-2 s) and immediately after (0 s) irradiation of a selected PDG with 405-nm light for 10 ms. The irradiated PDG is identified with a lightning bolt symbol, and photoactivation is evidenced by the immediate development of intense green fluorescence. Bar, 1 μm. (C) The PDG subjected to photoactivation in B was tracked over time and observed to engage in “kiss-and-run” activity with a second PDG (not photoactivated). Top, green channel (photoactivated LAMP-2-PAGFP); middle, red channel (VMAT2-Cherry); bottom, overlay. Red arrowheads track both PDGs at all times in the red channel. In the green channel, green arrowheads track the photoactivated PDG and open arrowheads indicate the second PDG that approaches and engages in “kiss-and-run” with the photoactivated PDG. Note the appearance of green fluorescence in the nonphotoactivated PDG (open arrowhead) starting at frame 254 s as a result of the “kiss.” The PDGs separate from each other (“run”) by frame 398 s. (D) MEG-01 cells expressing TPC2-Cherry and LAMP2-PAGFP were analyzed by spinning-disk confocal fluorescence microscopy. A frame of the video 2 s before photoactivation of a selected PDG. The highlighted area shows two PDGs connected by a tubule, one of which is subsequently photoactivated. Bar, 5 μm. (E) Magnified view of the area highlighted in D shown 2 s before (-2 s), immediately after (0 s), and at various time intervals after irradiation of a selected PDG with 405-nm light for 10 ms. The irradiated PDG is identified with a lightning bolt symbol, and photoactivation is evidenced by the immediate development of intense green fluorescence. Note that photoactivated LAMP2-PAGFP molecules quickly populate the connecting tubule and then the second PDG (indicated at all times with an open arrowhead in the green channel and a red arrowhead in the red channel). Bar, 1 μm.

Similar articles

Cited by

References

    1. Ambrosio AL, Boyle JA, Di Pietro SM. Mechanism of platelet dense granule biogenesis: study of cargo transport and function of Rab32 and Rab38 in a model system. Blood. 2012;120:4072–4081. - PMC - PubMed
    1. Brailoiu E, Churamani D, Cai X, Schrlau MG, Brailoiu GC, Gao X, Hooper R, Boulware MJ, Dun NJ, Marchant JS, Patel S. Essential requirement for two-pore channel 1 in NAADP-mediated calcium signaling. J Cell Biol. 2009;186:201–209. - PMC - PubMed
    1. Brailoiu E, Rahman T, Churamani D, Prole DL, Brailoiu GC, Hooper R, Taylor CW, Patel S. An NAADP-gated two-pore channel targeted to the plasma membrane uncouples triggering from amplifying Ca2+ signals. J Biol Chem. 2010;285:38511–38516. - PMC - PubMed
    1. Broos K, Feys HB, De Meyer SF, Vanhoorelbeke K, Deckmyn H. Platelets at work in primary hemostasis. Blood Rev. 2011;25:155–167. - PubMed
    1. Calcraft PJ, Ruas M, Pan Z, Cheng X, Arredouani A, Hao X, Tang J, Rietdorf K, Teboul L, Chuang KT, et al. NAADP mobilizes calcium from acidic organelles through two-pore channels. Nature. 2009;459:596–600. - PMC - PubMed

Publication types