

Genetic variation in insulin-induced kinase signaling
- PMID: 26202599
- PMCID: PMC4547848
- DOI: 10.15252/msb.20156250
Genetic variation in insulin-induced kinase signaling
Abstract
Individual differences in sensitivity to insulin contribute to disease susceptibility including diabetes and metabolic syndrome. Cellular responses to insulin are well studied. However, which steps in these response pathways differ across individuals remains largely unknown. Such knowledge is needed to guide more precise therapeutic interventions. Here, we studied insulin response and found extensive individual variation in the activation of key signaling factors, including ERK whose induction differs by more than 20-fold among our subjects. This variation in kinase activity is propagated to differences in downstream gene expression response to insulin. By genetic analysis, we identified cis-acting DNA variants that influence signaling response, which in turn affects downstream changes in gene expression and cellular phenotypes, such as protein translation and cell proliferation. These findings show that polymorphic differences in signal transduction contribute to individual variation in insulin response, and suggest kinase modulators as promising therapeutics for diseases characterized by insulin resistance.
Keywords: DNA variants; individual variation; insulin response; signal transduction; type 2 diabetes.
© 2015 The Authors. Published under the terms of the CC BY 4.0 license.
Figures
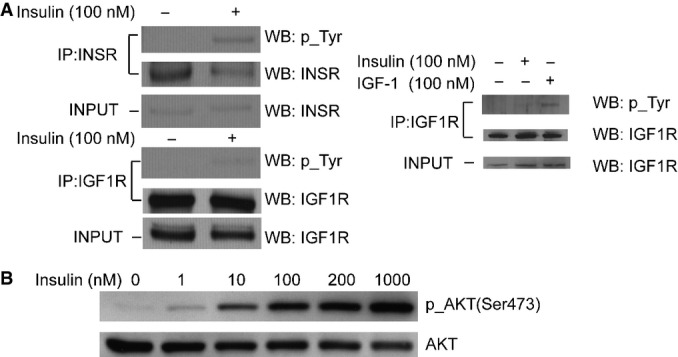
Insulin treatment induced tyrosine phosphorylation of the insulin receptor (INSR), but not the IGF1 receptor (IGF1R). INSR and IGF1R were pulled down using specific antibodies, and activation of each receptor was assessed by Western blot analysis with anti-phosphotyrosine antibody. The right panel shows IGF1R is activated by IGF-1 as a control experiment. Fibroblasts were treated with IGF-1 or insulin before IGF1R was immunoprecipitated and analyzed for phosphorylation of tyrosine.
Insulin treatment leads to phosphorylation of AKT, a known signaling factor activated by insulin. Cells were treated with a serial titration of insulin for 10 min before they were harvested and analyzed by Western blot. 100-nM insulin treatment was chosen for all following experiments as it is the midpoint of the dynamic range of insulin dose.
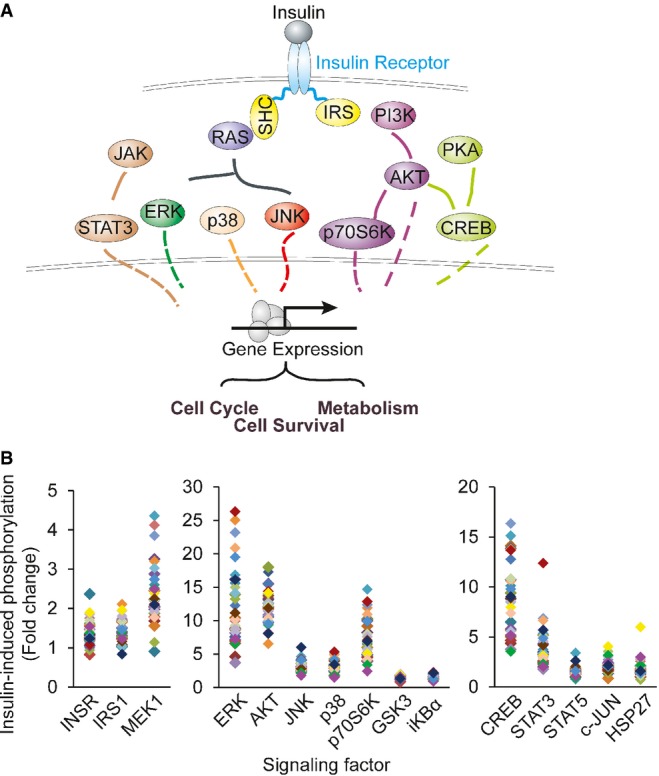
Schematic diagram of the factors along insulin signaling pathways.
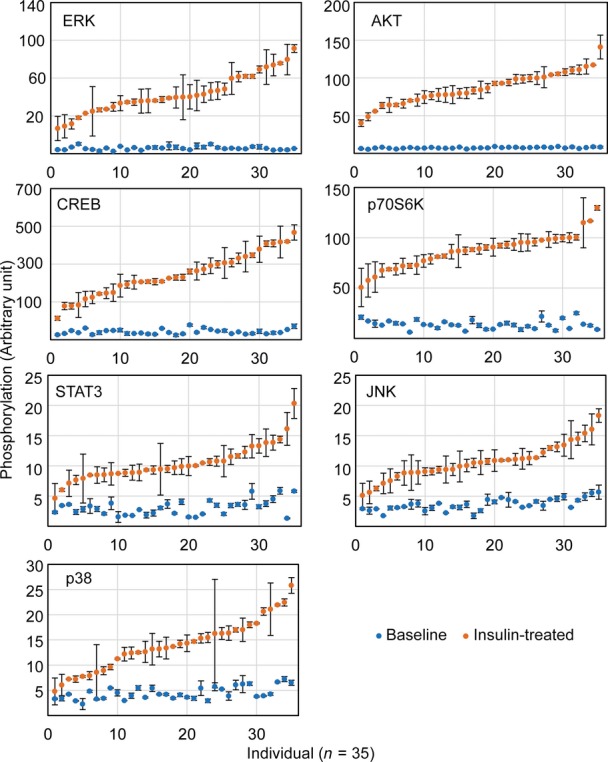
Results from Luminex assays show phosphorylation of the signaling factors 10 min following insulin treatment. Each individual is represented with a different color. Average phosphorylation levels of the biological duplicates from the same individual are shown.
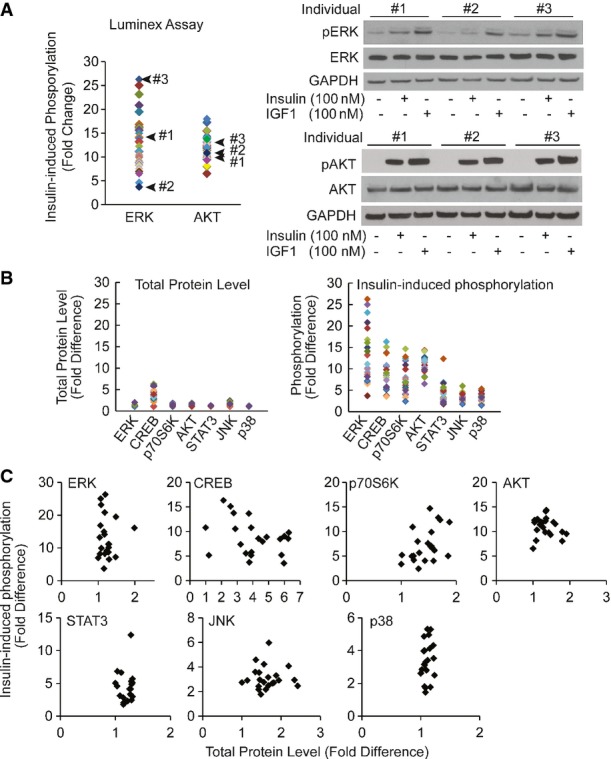
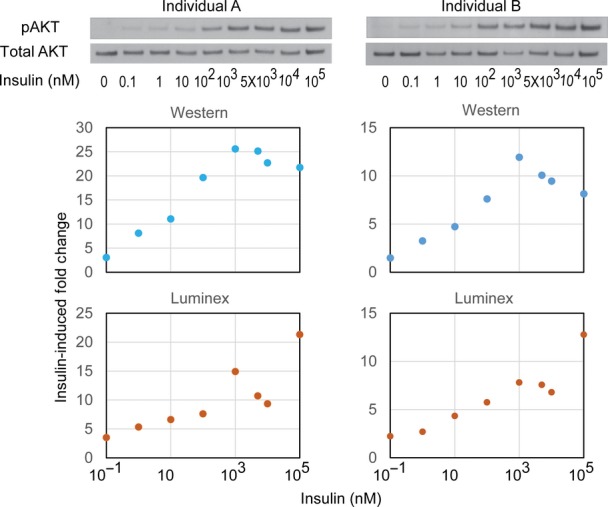
Individual difference in insulin-induced phosphorylation of ERK measured by Luminex assay is validated by Western blot. Skin fibroblasts from the indicated 3 individuals were treated with 100 nM insulin in duplicates. Cells were harvested and assayed using Luminex phosphorylation assay or Western blot using the same antibodies. Cells were treated with 100 nM IGF1 as a positive control. Total protein levels of AKT or ERK did not change before and after insulin treatment.
Compared to differences in phosphorylation levels, total protein levels are not as variable across individuals. Total protein levels or insulin-induced phosphorylation levels of 7 signaling factors shown in Fig5A were measured in 20 individuals by Luminex assay. Average value of biological duplicates is shown.
Fluctuation in total protein levels does not contribute to variation in phosphorylation levels induced by insulin. The same data as in (B) were re-plotted to show there is no correlation between phosphorylation levels and total protein levels.
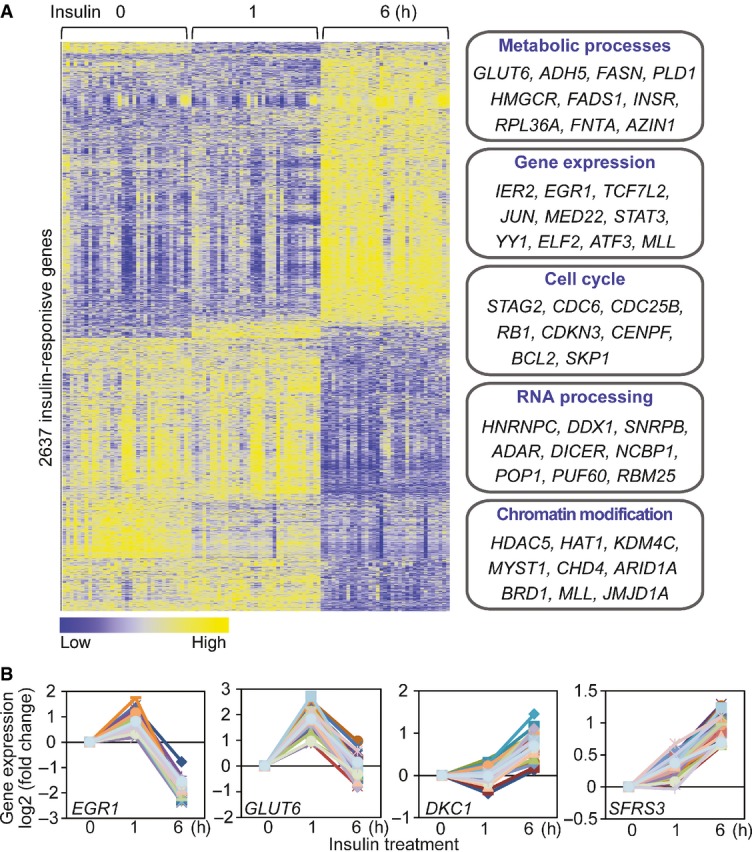
Heatmap shows the expression levels of 2,637 insulin-responsive genes (P < 10−6; ANOVA). Examples of genes that are involved in various biological processes are listed.
Examples of insulin-responsive genes, including those known to be regulated by insulin (EGR1, GLUT6), and those that were not previously implicated in insulin response (DKC1, SFRS3).
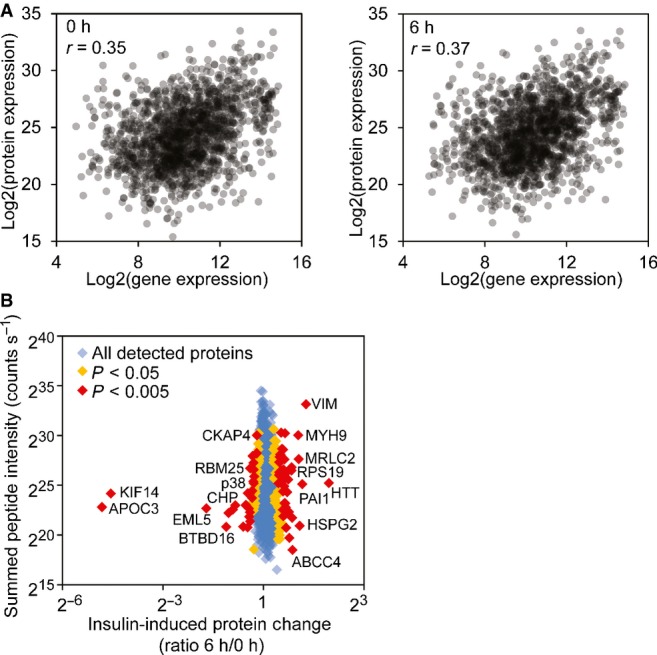
Correlations of protein and gene expression levels before and after insulin treatment. The gene expression levels are averages from our 35 subjects.
Protein expression changes after insulin treatment quantified by mass spectrometry (SILAC). Examples of proteins with significant changes of expression are annotated (MaxQuant Significance B statistical test).
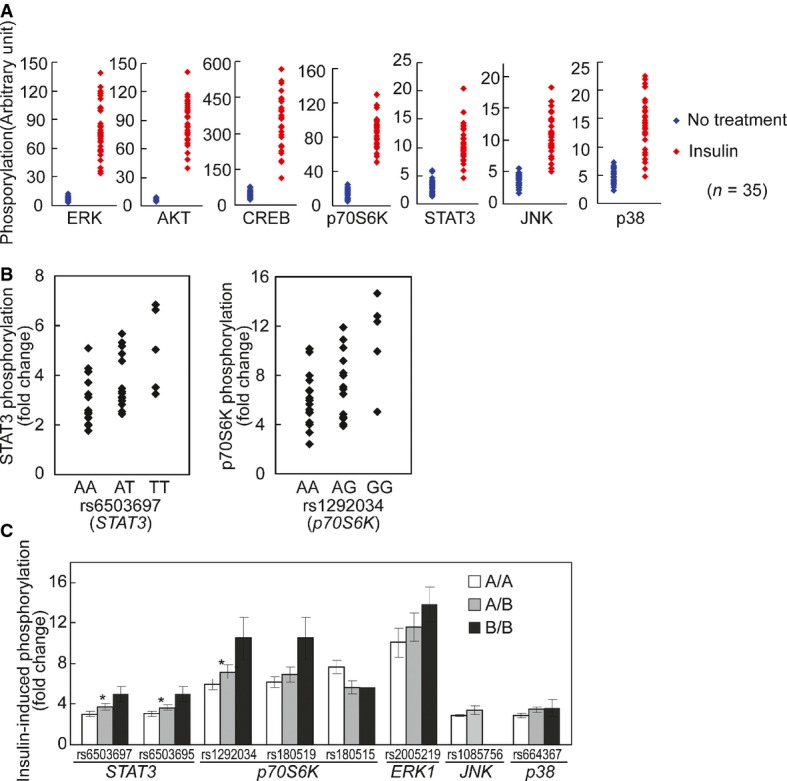
Phosphorylation of signaling factors differs extensively among individuals following insulin treatment compared to those at baseline. The data in Fig2A are re-plotted here to contrast the phosphorylation before and after insulin treatment.
Cis-regulation of the activation of signaling proteins after insulin treatment. Association analysis shows allelic differences in insulin-induced phosphorylation of STAT3 and p70S6K. The extent of phosphorylation for each signaling protein is plotted by genotypes of 34 individuals (one outlier was removed).
Results from association analysis of additional SNPs. For all SNPs, the order of presentations is AA, AB and BB where A is the common allele and B is the minor allele (* denotes corrected P-value < 0.03 in association analysis). Significant allelic associations with cis-acting SNPs were found for phosphorylation of STAT3 with rs6503697 (chr17:42349561; Pc = 0.006) and rs6503695 (chr17:42347515; Pc = 0.013) and for phosphorylation of p70S6K with rs1292034 (chr17:59912499; Pc = 0.028).
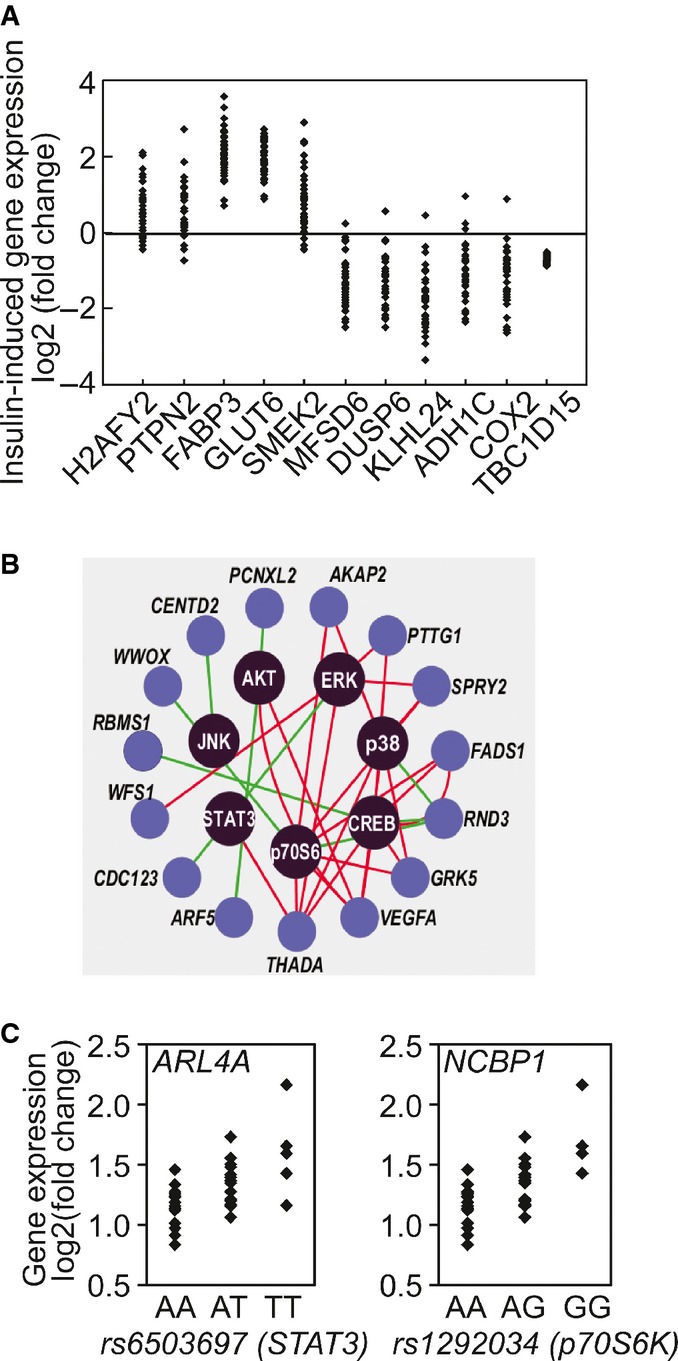
Example of 10 genes whose gene expression responses following insulin treatment vary among individuals. Changes in the expression of TBC1D15, in contrast, are similar among all subjects.
Insulin-induced changes in expression levels of susceptibility genes for type 2 diabetes (previously identified in genome-wide association studies) are correlated with phosphorylation of signaling factors. Red line denotes positive correlation and green line denotes negative correlation.
SNPs in STAT3 and p70S6K show allelic association with insulin-induced expression changes of ARL4A and NCBP1, respectively.
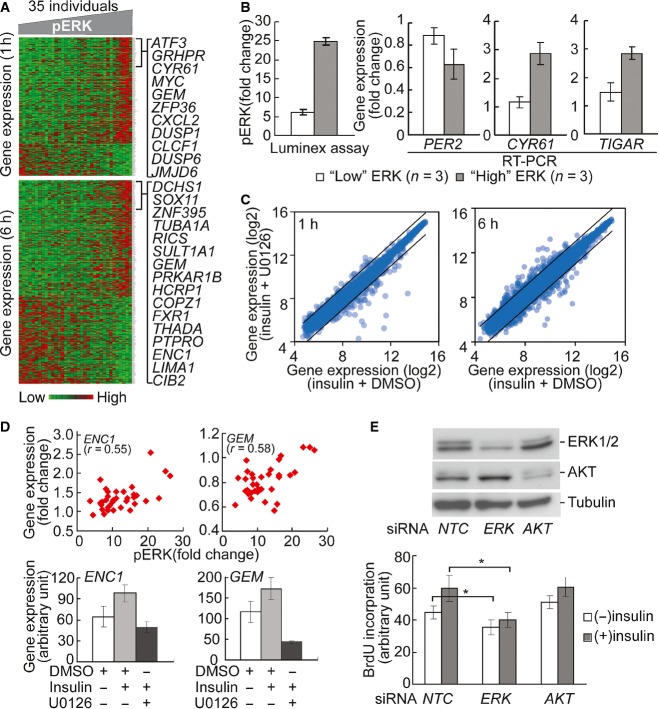
The heatmap shows the expression levels of genes that are correlated (r > 0.4) with phosphorylation of ERK at 1 and 6 h. Columns in the heatmap are sorted according to phosphorylation level of ERK. Similar correlations between genes and other signaling factors were found (data not shown).
Quantitative PCR validates that insulin-induced gene expression is significantly different (P < 0.05, t-test) between individuals with high and low ERK phosphorylation. Insulin-induced ERK phosphorylation in 3 individuals with “high” and “low” induction was quantified by Luminex assay. Gene expression levels were measured using quantitative RT–PCR. Error bars represent SEM among 3 individuals of each group.
U0126 treatment led to change in expression level of genes that are correlated with ERK phosphorylation. Lines in scatter plots indicate threshold of 2-fold change.
Two examples of genes regulated by ERK. Changes in expression levels of ENC1 and GEM1 are correlated with ERK phosphorylation. Following ERK inhibition by U0126, their expression response diminished. Cells from 4 individuals were treated and average values are shown. Error bars represent SEM among 4 individuals.
Knockdown of ERK1 inhibits cell cycle progression. Western blot shows that siRNA knockdown of ERK1 and AKT resulted in reduction of protein level. NTC, negative control siRNA. BrdU incorporation assay shows that ERK1 knockdown reduced insulin-induced DNA synthesis. In contrast, AKT knockdown did not affect BrdU incorporation. Average values from 4 individuals are shown. Error bars represent SEM. *P < 0.02; paired t-test.
References
-
- Aalto-Setälä K, Fisher EA, Chen X, Chajek-Shaul T, Hayek T, Zechner R, Walsh A, Ramakrishnan R, Ginsberg HN, Breslow JL. Mechanism of hypertriglyceridemia in human apolipoprotein (apo) CIII transgenic mice. Diminished very low density lipoprotein fractional catabolic rate associated with increased apo CIII and reduced apo E on the particles. J Clin Invest. 1992;90:1889–1900. - PMC - PubMed
-
- Ashburner M, Ball CA, Blake JA, Botstein D, Butler H, Cherry JM, Davis AP, Dolinski K, Dwight SS, Eppig JT, Harris MA, Hill DP, Issel-Tarver L, Kasarskis A, Lewis S, Matese JC, Richardson JE, Ringwald M, Rubin GM, Sherlock G. Gene ontology: tool for the unification of biology. The Gene Ontology Consortium. Nat Genet. 2000;25:25–29. - PMC - PubMed
-
- Bost F, Aouadi M, Caron L, Binétruy B. The role of MAPKs in adipocyte differentiation and obesity. Biochimie. 2005;87:51–56. - PubMed
Publication types
MeSH terms
Substances
Grants and funding
LinkOut - more resources
Full Text Sources
Other Literature Sources
Medical
Molecular Biology Databases
Miscellaneous
