. 2015 Nov 15;21(22):5100-9.
doi: 10.1158/1078-0432.CCR-15-0313. Epub 2015 Jul 22.

Cyclin-Dependent Kinase Inhibitor AT7519 as a Potential Drug for MYCN-Dependent Neuroblastoma

Affiliations

Cyclin-Dependent Kinase Inhibitor AT7519 as a Potential Drug for MYCN-Dependent Neuroblastoma

M Emmy M Dolman et al. Clin Cancer Res. .

Abstract

Purpose: MYCN-dependent neuroblastomas have low cure rates with current multimodal treatment regimens and novel therapeutic drugs are therefore urgently needed. In previous preclinical studies, we have shown that targeted inhibition of cyclin-dependent kinase 2 (CDK2) resulted in specific killing of MYCN-amplified neuroblastoma cells. This study describes the in vivo preclinical evaluation of the CDK inhibitor AT7519.

Experimental design: Preclinical drug testing was performed using a panel of MYCN-amplified and MYCN single copy neuroblastoma cell lines and different MYCN-dependent mouse models of neuroblastoma.

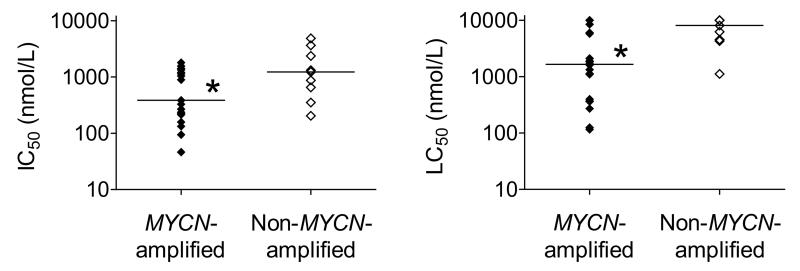
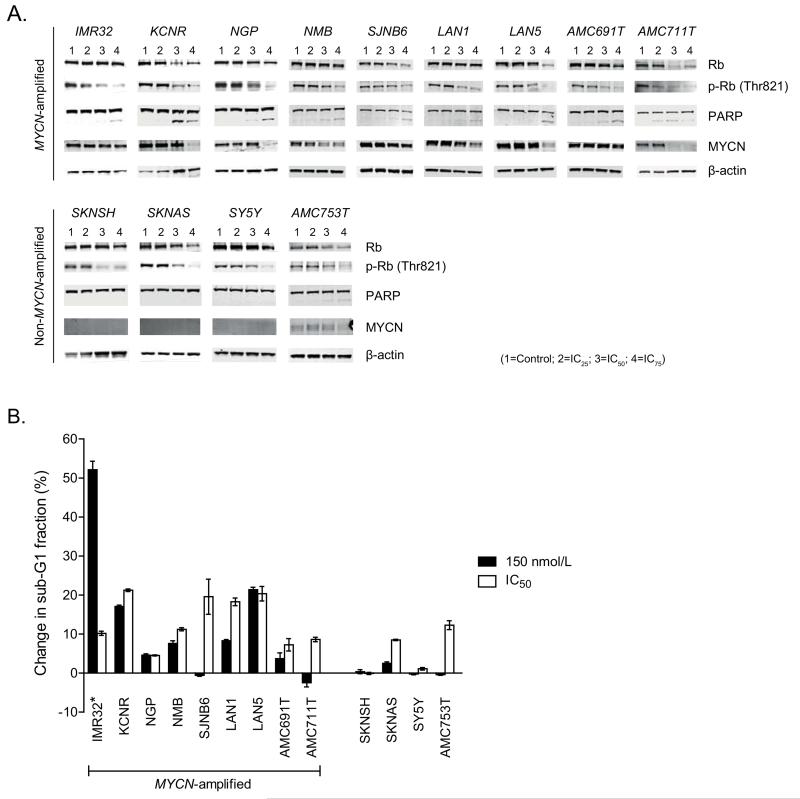
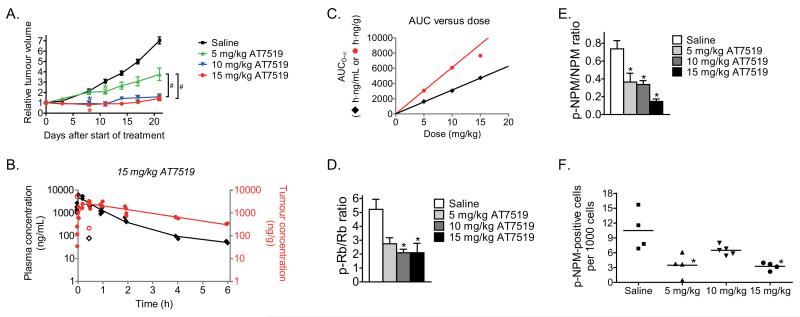
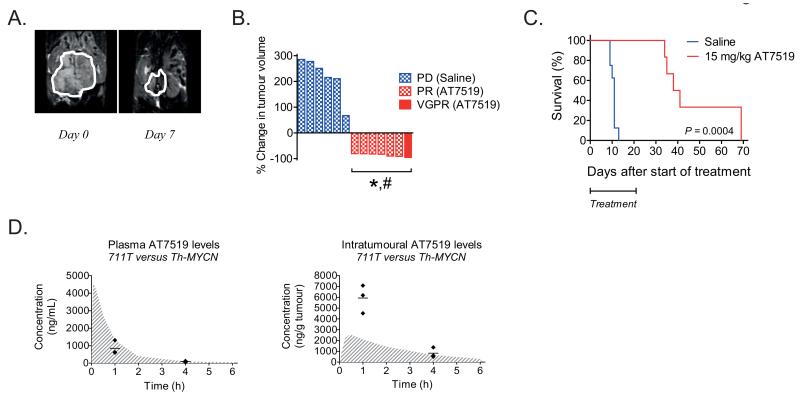
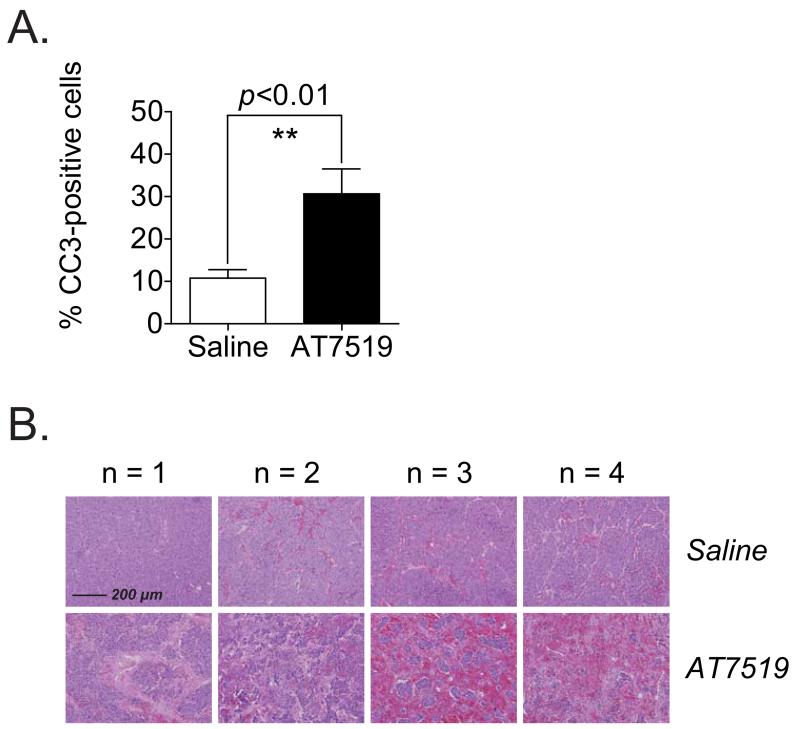
Results: AT7519 killed MYCN-amplified neuroblastoma cell lines more potently than MYCN single copy cell lines with a median LC50 value of 1.7 compared to 8.1 μmol/L (P = 0.0053) and a significantly stronger induction of apoptosis. Preclinical studies in female NMRI homozygous (nu/nu) mice with neuroblastoma patient-derived MYCN-amplified AMC711T xenografts revealed dose-dependent growth inhibition, which correlated with intratumoral AT7519 levels. CDK2 target inhibition by AT7519 was confirmed by significant reductions in levels of phosphorylated retinoblastoma (p-Rb) and nucleophosmin (p-NPM). AT7519 treatment of Th-MYCN transgenic mice resulted in improved survival and clinically significant tumor regression (average tumor size reduction of 86% at day 7 after treatment initiation). The improved efficacy of AT7519 observed in Th-MYCN mice correlated with higher tumor exposure to the drug.

Conclusions: This study strongly suggests that AT7519 is a promising drug for the treatment of high-risk neuroblastoma patients with MYCN amplification.


Figures

Figure 1
Figure 1
MYCN-amplified neuroblastoma cells are more sensitive to AT7519 than non-MYCN-amplified neuroblastoma cells. IC50 (left) and LC50 values (right) of AT7519 were determined for 20 MYCN-amplified and 9 non-MYCN-amplified neuroblastoma cell lines. The lower values observed for MYCN-amplified neuroblastoma cells showed that these cells are more sensitive to AT7519. Statistical analysis was performed using one-tailed unpaired Student’s t-test, with P < 0.05 (indicated as *) as the minimum level of significance. Horizontal lines indicate median values.
Figure 2
Figure 2
AT7519 causes a more pronounced apoptotic response in MYCN-amplified neuroblastoma cells. A, Western Blot analysis of the in vitro effects of AT7519 on Rb phosphorylation, PARP cleavage and MYCN protein expression after 48 h treatment with concentrations equal to the IC25, IC50 or IC75 for each individual cell line (IC25, IC50 and IC75 values are specified in Supplementary Table S1). β-actin was used as household protein. Because of the limited expression of β-actin in neuroblastoma cell line SJNB6, α-tubulin was used as household protein for SJNB6. B, FACS analysis of the in vitro effects of AT7519 on sub-G1 induction after 72 h treatment. *As 72 h treatment of IMR32 cells with 150 nmol/L AT7519 resulted in complete cell degradation, IMR32 cells were treated with 100 nmol/L instead of 150 nmol/L AT7519.
Figure 3
Figure 3
Loss of Rb and NPM phosphorylation are biomarkers for the inhibitory effects of AT7519 on the growth of MYCN-amplified AMC711T neuroblastoma xenografts in mice. A, inhibitory effects of AT7519 on the growth of AMC711T neuroblastoma xenografts in mice. Relative tumour volume was calculated as the volume at the indicated day after start of treatment divided by the volume prior to treatment initiation. Data represent the mean relative tumour volume +/− S.E.M. (Group sizes: n = 10 (saline), n = 8 (5 mg/kg), n = 8 (10 mg/kg) and n = 11 (15 mg/kg)). Statistical differences between AT7519 treated and saline treated groups are indicated on the first day after treatment initiation at which a statistically different effect was observed (*). Statistical differences between the different doses AT7519 are indicated as #. B, plasma and intratumoural drug levels after administration of a single i.p. injection of 15 mg/kg AT7519 to mice bearing MYCN-amplified AMC711T neuroblastoma xenografts. Plasma AT7519 concentrations established at 1 min after administration have been averaged for curve fitting. Each symbol represents a single data point (tumour, solid red circles; plasma, solid black diamonds) and continuous lines represent the fitted curves. Outliers were calculated using Dixon’s Q-test at a 95% confidence level. One tumour sample (i.e. 214.3 ng/g AT7519 at 0.5 h after administration) has been considered outlier based on corresponding plasma levels. Outliers are indicated by unfilled red circles for tumour samples and unfilled black diamonds for plasma samples. C, in vivo correlation between drug exposure (AUC0-∞) and AT7519 dose (tumour, red circles; plasma, black diamonds). D and E, in vivo inhibitory effects of AT7519 on the tumour phosphorylation states of the CDK2 targets Rb (D) and NPM (E). Phosphorylation states have been expressed as the ratio between phosphorylated and non-phosphorylated protein levels. β-actin was used as household protein. Data represent mean values +/− S.E.M. (n = 4 per group). F, in vivo inhibitory effects of AT7519 on phosphorylated NPM levels were confirmed by immunohistochemistry. Quantification was performed by manual counting of the number of p-NPM-positive cells in 40 microscopic fields per mouse sample at 40× magnification. The total cell number per field was estimated from hematoxylin-eosin stained tumour sections. Each symbol in the graph represents the average number of p-NPM-positive cells per 1000 cells for each individual mouse. All statistical differences were calculated using one-way analysis of variance (ANOVA) Bonferroni adjustment and are indicated as *, unless stated otherwise. P-values < 0.05 were considered significant.
Figure 4
Figure 4
AT7519 causes tumour volume reduction in Th-MYCN transgenic mice and improves overall survival. A, representative anatomical T2-weighted coronal MRI images for one of the AT7519-treated mice, showing the tumour prior to treatment (day 0; left) and at day 7 after treatment initiation (right). B, waterfall plot of the in vivo effects of AT7519 on tumour volume in Th-MYCN transgenic mice. The waterfall plot displays the % change in tumour volume at day 7 after treatment initiation for each individual mouse. Blue and white block bars represent the saline treated mice. The red bar and red and white block bars represent the mice treated with 15 mg/kg AT7519. PD = Progressive disease, PR = partial response (i.e. 50-95% tumour volume reduction) and VGPR = very good partial response (i.e. 95-99.99% tumour volume reduction). Statistical differences between the tumour size before and after treatment were calculated using one-tailed paired Student’s t-test and are indicated as #. Statistical differences between the AT7519 treated and saline treated group were calculated using one-tailed unpaired Student’s t-test and are indicated as *. P-values < 0.05 were considered significant. C, Kaplan-Meier curve to show the long-term survival after three weeks treatment with saline (n = 8; blue line) or AT7519 (n = 6; red line). Statistical analysis was performed using the Logrank (Mantel-Cox) test, with P < 0.05 as the minimum level of significance. D, comparison between plasma (left) and intratumoural (right) drug levels obtained in Th-MYCN transgenic mice and the AMC711T neuroblastoma xenograft model after administration of a single i.p. injection of 15 mg/kg AT7519. Gray and white line print areas in both graphs show again the fitted curves for the AMC711T neuroblastoma xenograft model. For the Th-MYCN transgenic mice, drug levels were established at 1 h and 4 h after administration of AT7519 (n = 3 per group) and individual data points (◆) as well as average drug levels (—) are shown in the graphs.
Figure 5
Figure 5
AT7519 treatment of Th-MYCN transgenic mice results in massive apoptosis. Th-MYCN transgenic mice were treated with a daily i.p. injection of saline or 15 mg/kg AT7519 (n = 4 per group) for five consecutive days. At 6 h after administration of the last dose, tumour samples were collected for immunohistochemistry analysis of cleaved caspase 3 and hematoxylin-eosin staining. A, stimulatory effect of AT7519 on the pro-apoptotic marker cleaved caspase 3. Quantification was performed by manual counting of the total number of cells and the number of cleaved caspase 3-positive cells in 10 microscopic fields per mouse sample at 40× magnification (30% of each field). The average percentage of cleaved caspase 3-positive cells for each mouse was used to study the inducible effect of AT7519. Statistical differences between the AT7519 treated and saline treated group were calculated using one-tailed unpaired Student’s t-test and are indicated as ** (P < 0.01). B, representative microscopic images of hematoxylin-eosin stained paraffin-embedded tumour sections of saline treated and AT7519 treated mice (n = 4 per group). Magnification of the images: 10×. Scale bar: 200 μm.

Similar articles

Cited by

References

    1. Valentijn LJ, Koster J, Haneveld F, Aissa RA, van Sluis P, Broekmans ME, et al. Functional MYCN signature predicts outcome of neuroblastoma irrespective of MYCN amplification. Proc Natl Acad Sci U S A. 2012;109(47):19190–5. - PMC - PubMed
    1. Chan DA, Giaccia AJ. Harnessing synthetic lethal interactions in anticancer drug discovery. Nat Rev Drug Discov. 2011;10(5):351–64. - PMC - PubMed
    1. Kaelin WG., Jr. The concept of synthetic lethality in the context of anticancer therapy. Nat Rev Cancer. 2005;5(9):689–98. - PubMed
    1. Fong PC, Boss DS, Yap TA, Tutt A, Wu P, Mergui-Roelvink M, et al. Inhibition of poly(ADP-ribose) polymerase in tumors from BRCA mutation carriers. N Engl J Med. 2009;361(2):123–34. - PubMed
    1. Murga M, Campaner S, Lopez-Contreras AJ, Toledo LI, Soria R, Montana MF, et al. Exploiting oncogene-induced replicative stress for the selective killing of Myc-driven tumors. Nat Struct Mol Biol. 2011;18(12):1331–5. - PMC - PubMed

Publication types

MeSH terms