. 2015 Sep;114(3):1931-46.
doi: 10.1152/jn.00416.2015. Epub 2015 Jul 22.

Inducing hindlimb locomotor recovery in adult rat after complete thoracic spinal cord section using repeated treadmill training with perineal stimulation only

Affiliations

Inducing hindlimb locomotor recovery in adult rat after complete thoracic spinal cord section using repeated treadmill training with perineal stimulation only

Olivier Alluin et al. J Neurophysiol. 2015 Sep.

Abstract

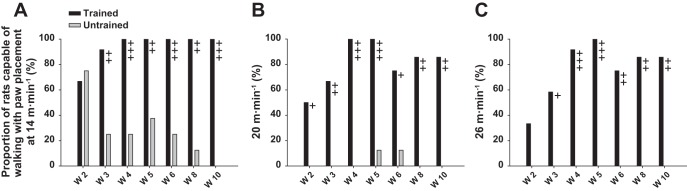
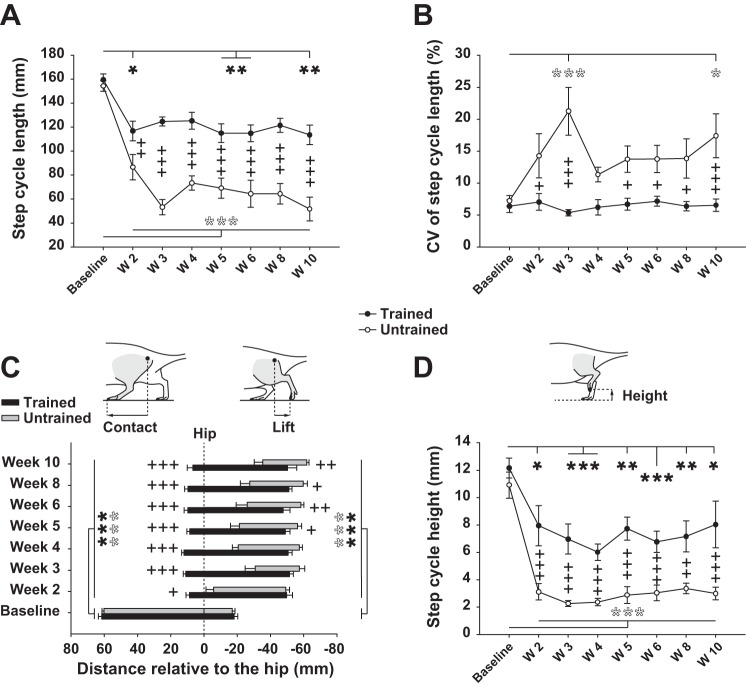
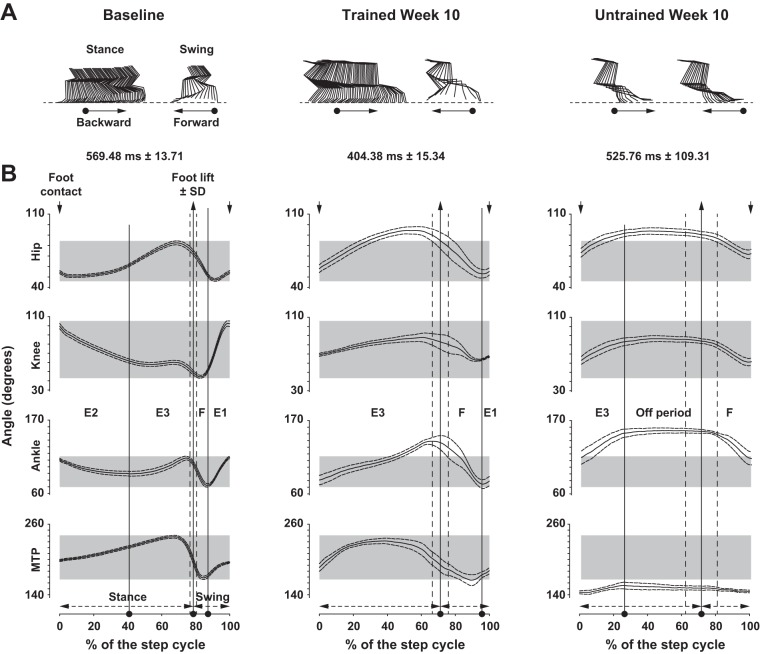
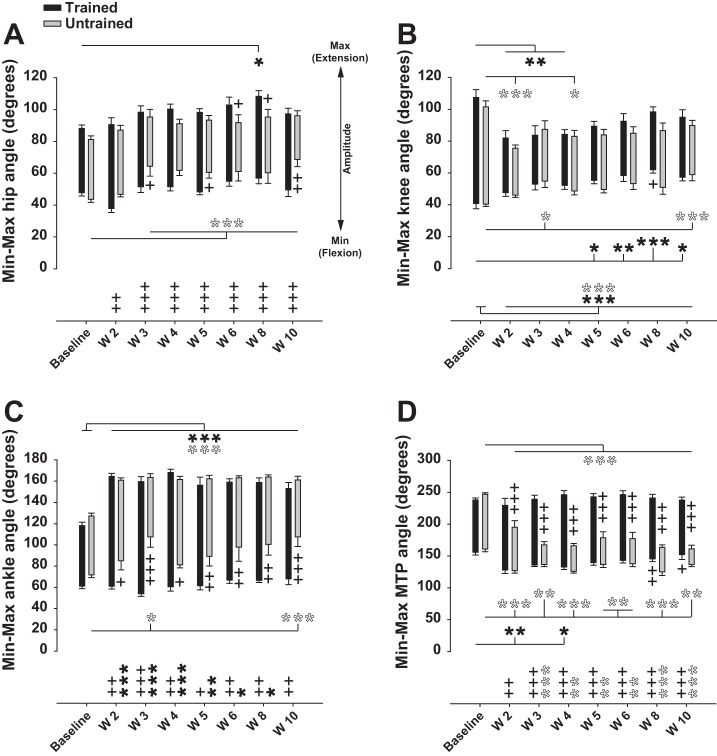
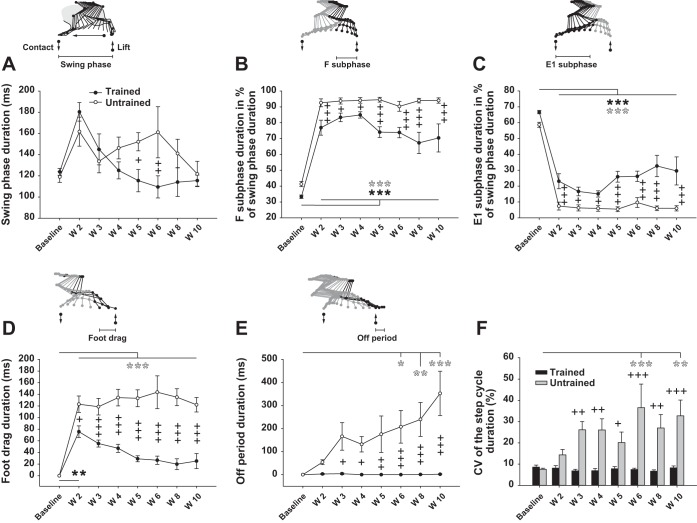
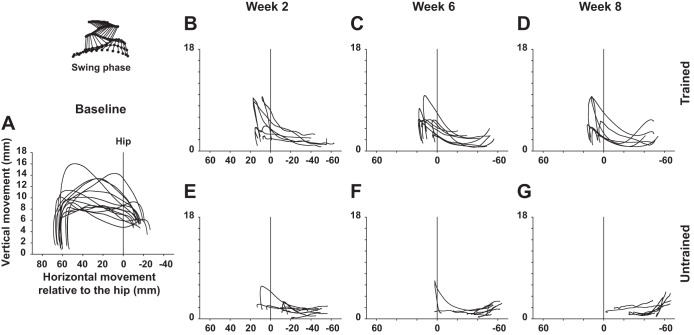
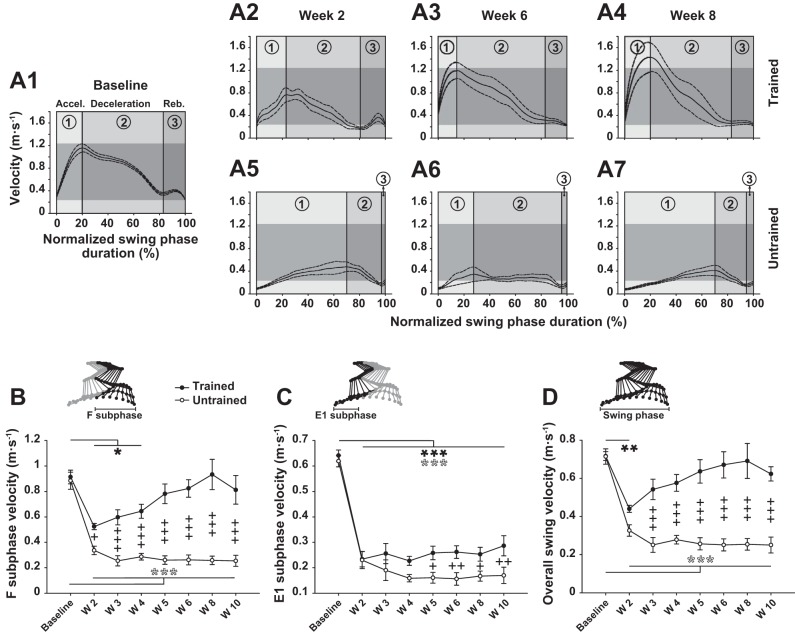
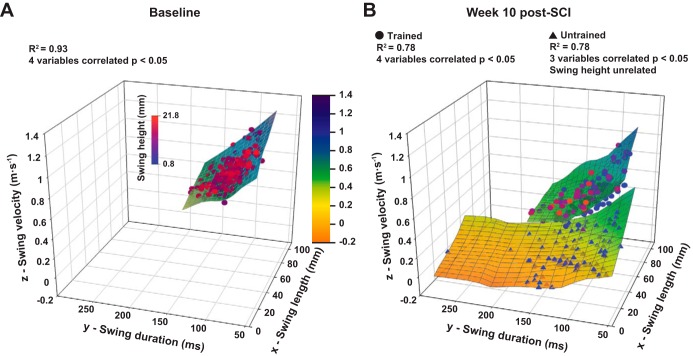
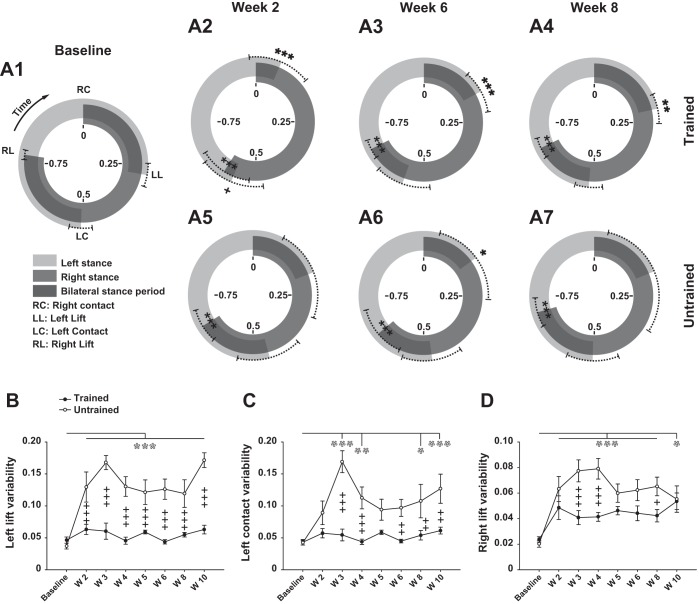
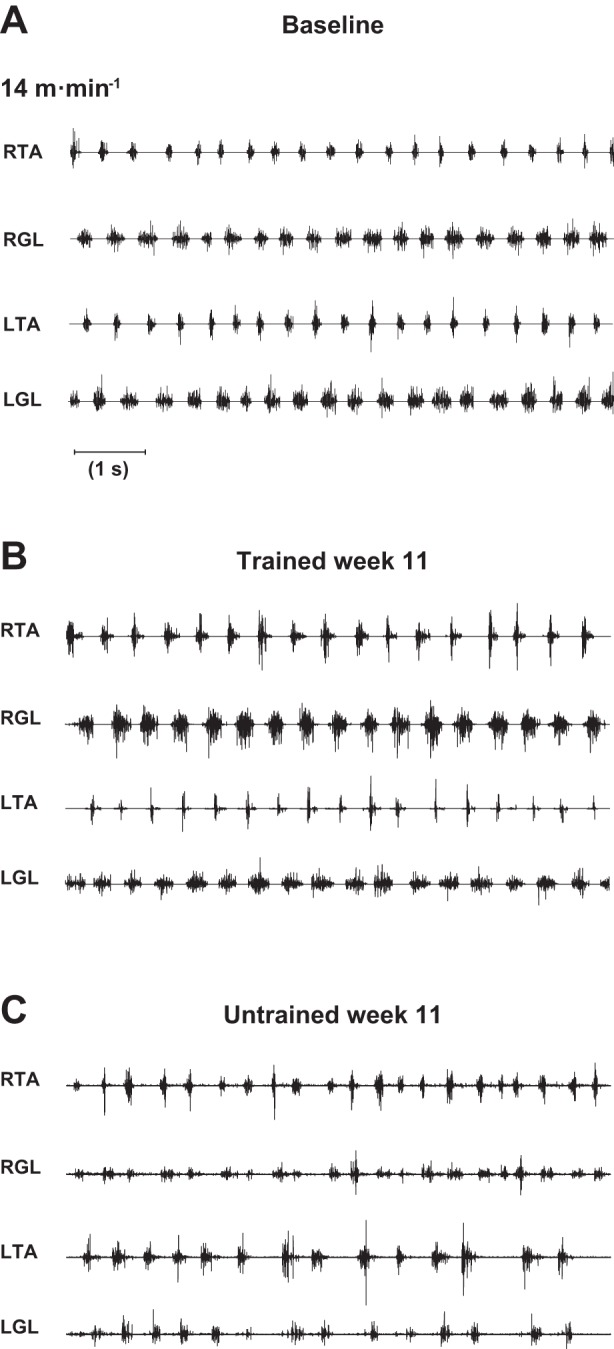
Although a complete thoracic spinal cord section in various mammals induces paralysis of voluntary movements, the spinal lumbosacral circuitry below the lesion retains its ability to generate hindlimb locomotion. This important capacity may contribute to the overall locomotor recovery after partial spinal cord injury (SCI). In rats, it is usually triggered by pharmacological and/or electrical stimulation of the cord while a robot sustains the animals in an upright posture. In the present study we daily trained a group of adult spinal (T7) rats to walk with the hindlimbs for 10 wk (10 min/day for 5 days/wk), using only perineal stimulation. Kinematic analysis and terminal electromyographic recordings revealed a strong effect of training on the reexpression of hindlimb locomotion. Indeed, trained animals gradually improved their locomotion while untrained animals worsened throughout the post-SCI period. Kinematic parameters such as averaged and instant swing phase velocity, step cycle variability, foot drag duration, off period duration, and relationship between the swing features returned to normal values only in trained animals. The present results clearly demonstrate that treadmill training alone, in a normal horizontal posture, elicited by noninvasive perineal stimulation is sufficient to induce a persistent hindlimb locomotor recovery without the need for more complex strategies. This provides a baseline level that should be clearly surpassed if additional locomotor-enabling procedures are added. Moreover, it has a clinical value since intrinsic spinal reorganization induced by training should contribute to improve locomotor recovery together with afferent feedback and supraspinal modifications in patients with incomplete SCI.

Keywords: kinematics; locomotion; neuroplasticity; rat; spinal cord injury.


Figures

Fig. 1.
Fig. 1.
General walking capacity throughout the recovery period [weeks (W) 2–10]. A: proportion of rats in trained (n = 13) and untrained (n = 8) groups capable of walking with paw placements (plantar or dorsal) on treadmill at 14 m/min, expressed as % of total number of animals in each group. B: same as A at 20 m/min. C: same as A and B at 26 m/min. +P ≤ 0.05, ++P ≤ 0.01, +++P ≤ 0.001, for comparison between experimental groups at the same time point after spinal cord injury (SCI).
Fig. 2.
Fig. 2.
Recovery of step cycle length, position, and height after SCI. A: length of step cycle (from foot contact on treadmill belt to the next one) before (baseline) and weekly after SCI in trained and untrained rats. B: individual coefficient of variation (CV; individual step-to-step variability averaged by groups and expressed in %) of data depicted in A. C: position of the foot relative to the vertical projection of the great trochanter (vertical dashed line corresponding to 0) for the time points specified above. Left end of each bar represents the contact position of the left foot with the treadmill belt (onset of stance phase); right end represents the foot lift position (end of the stance phase) in trained and untrained rats. Sketches representing the foot contact and lift position measurement are given above the graph. D: maximum height of the foot during the swing phase of locomotion in trained and untrained rats for the time points specified above. Sketch depicting the foot height measurement is given above the graph. Data were recorded at 14 m/min and are expressed as means ± SE. *P ≤ 0.05, **P ≤ 0.01, ***P ≤ 0.001, compared with group average baseline (black and white asterisks correspond to trained and untrained groups, respectively); +P ≤ 0.05, ++P ≤ 0.01, +++P ≤ 0.001, for comparison between experimental groups at the same time point after SCI.
Fig. 3.
Fig. 3.
Recovery of angular excursions. A: stick figures of stance and swing phases from representative rats before (left) and at week 10 after SCI in trained (center) and untrained (right) groups. The direction of movement is given (arrows). B: angular excursions averaged by groups of hip, knee, ankle, and metatarso-phalanx (MTP) before (left) and at week 10 in trained (center) and untrained (right) groups. Step cycle duration (x-axis) is normalized in % of the step cycle beginning and finishing with a foot contact (down arrows at top). Average ± SE duration of the step cycle is depicted above each panel. The position of foot lift ± SD (up arrows at top), the proportion of stance and swing phases (bottom), and the Philippson's subphases are also given. The “off period” (right) corresponds to the absence of active hindlimb movement. Data were recorded at 14 m/min and are expressed as means ± SE.
Fig. 4.
Fig. 4.
Recovery of hindlimb angle joint amplitude after SCI. A: averaged minimum, maximum, and amplitude of hip joint angle during locomotion on treadmill before and weekly after SCI in trained and untrained rats. B: same as A for knee joint angle. C: same as A and B for ankle joint angle. D: same as A–C for MTP joint angle. Black and white asterisks below and above the sticks represent the statistical comparison of minimum and maximum angle values with baseline in trained and untrained groups, respectively. Plus signs below and above the sticks represent the statistical comparison between both groups for minimum and maximum angle values, respectively, at each time point. Symbols at bottom graphs relate to the angle amplitude (max − min illustrated by length of sticks) and follow the same rules as described above. Data were recorded at 14 m/min and are expressed as means ± SE. *P ≤ 0.05, **P ≤ 0.01, ***P ≤ 0.001, compared with group average baseline; +P ≤ 0.05, ++P ≤ 0.01, +++P ≤ 0.001, for comparison between experimental groups at the same time point after SCI.
Fig. 5.
Fig. 5.
Effect of treadmill training on temporal characteristics of locomotion. A: duration of the swing phase of locomotion averaged by group in trained and untrained rats before (baseline) and weekly throughout the recovery period. Schematic representation of the swing phase of locomotion demarcated by the foot lift and contact (up and down arrows, respectively) and the movement direction are given above the graph. B: duration of the F subphase of the swing (flexion part) expressed in % of the whole swing duration. C: duration of the E1 subphase of the swing (extension part) expressed in % of the whole swing duration. D: duration of the foot drag period on the treadmill belt during the swing phase of locomotion. E: duration of the period with no movement of the hindlimb, named the “off period,” before the onset of the swing phase. F: individual CV (step-to-step variability expressed in %) of the whole step cycle duration and averaged in trained and untrained rats. Data were recorded at 14 m/min and are expressed as means ± SE. *P ≤ 0.05, **P ≤ 0.01, ***P ≤ 0.001, compared with group average baseline; +P ≤ 0.05, ++P ≤ 0.01, +++P ≤ 0.001, for comparison between experimental groups at the same time point after SCI.
Fig. 6.
Fig. 6.
Evolution of hindlimb foot trajectory during the swing phase after SCI. A: superimposed averaged trajectory of the third toe in normal rats during the swing phase of locomotion on treadmill. Scale of the y-axis (vertical foot displacements) is increased (zoomed in) compared with the x-axis for better depiction and comparison of the vertical amplitude. Vertical line labeled as Hip represents the vertical projection of the great trochanter and corresponds to the reference (0 value) on the x-axis. B–D: representations similar to A in trained rats weeks 2, 6, and 8 after SCI, respectively. E–G: representations similar to B–D in untrained rats at the same time points. Data are expressed as averaged instant position relative to the hip (x-axis) and the treadmill belt (y-axis).
Fig. 7.
Fig. 7.
Effect of treadmill training on recovery of swing phase velocity. A1–A7: averaged instant velocity of the left foot against normalized swing phase duration before (A1) and at weeks 2, 6, and 8 after SCI in trained (A2–A4) and untrained (A5–A7) groups. Height of horizontal grey strips depicted on each panel reflects range of normal instant velocity (baseline) for direct comparison with the different epochs after SCI. The subdivisions of the instant velocity [i.e., acceleration (1), deceleration (2), and rebound (3)] are specified in each chart and separated by vertical lines. B–D: averaged velocity of the left foot during F and E1 subphases of swing and the overall swing phase, respectively, in trained and untrained groups. The corresponding phase and subphases of the step cycle are indicated above each panel on the stick diagram. Data were recorded at 14 m/min and are expressed as means ± SE. *P ≤ 0.05, **P ≤ 0.01, ***P ≤ 0.001, compared with group average baseline; +P ≤ 0.05, ++P ≤ 0.01, +++P ≤ 0.001, for comparison between experimental groups at the same time point after SCI.
Fig. 8.
Fig. 8.
Recovery of hindlimb duration, length, velocity, and height relationship at the end of the experiment. A: fitted hyperplane of 3 independent variables {swing length (x), swing velocity (z), and swing height [dot color gradient] predicting the swing duration [dependent variable (y)]} in normal animals. The hyperplane color gradient (from orange to dark blue) represents the z-axis values to help the spatial representation of the plane. Each dot represents 1 step cycle, and the swing height values are represented by the blue to red color gradient of the dots. R2 of the multiple correlation, number of variables correlated, and P value are given at top. B: same representation as A at week 10 after SCI in trained (top plane) and untrained (bottom plane) animals. Data are raw data.
Fig. 9.
Fig. 9.
Evolution of hindlimb coordination after SCI. A1–A7: circular representation of temporal relationship of hindlimb locomotor events (right contact, left lift, left contact, and right lift) before (baseline) and at weeks 2, 6, and 8 after SCI in trained (top) and untrained (bottom) groups during locomotion. Given that continuous locomotion is a repeated sequence of events (left/right foot contact/lift), the foot contact is both the beginning of a step cycle and the end of the previous one. Consequently, in this figure the relative duration of the right step cycle (reference) is represented between 0 and 1, which are at the same position on the graph (top of circles). Data are synchronized on the right contact (represented by 0 at top of each circle), and the sequence of events should be read in the clockwise direction. Dark gray circular band between RC and RL represents the averaged normalized right stance phase, and empty space between RL and RC represents the normalized average of the concomitant swing phase, both relative to the right step cycle duration. Light gray circular band between LC and LL and empty space between LL and LC represent the averaged normalized left stance and swing phases relative to the right step cycle duration, respectively. Limits of the dotted lines either side of the averaged position of each event represent the circular dispersion (equivalent to SD in the circular mathematical model). B–D: evolution of individual left lift, left contact, and right lift dispersion (step-to-step individual variability), respectively, averaged by group before and weekly throughout the recovery period. Data were recorded at 14 m/min and are expressed as circular mean ± circular dispersion in A1–A7 and as standard arithmetic mean ± SE in B–D. *P ≤ 0.05, **P ≤ 0.01, ***P ≤ 0.001, compared with group average baseline (black and white asterisks correspond to trained and untrained groups, respectively); +P ≤ 0.05, ++P ≤ 0.01, +++P ≤ 0.001, for comparison between experimental groups at the same time point after SCI.
Fig. 10.
Fig. 10.
Recovery of hindlimb EMG pattern during locomotion on treadmill. A: raw EMG activity of right (RTA) and left (LTA) tibialis anterior and right (RGL) and left (LGL) gastrocnemius lateralis in typical normal rat walking on the treadmill at 14 m/min. B: representation similar to A in a typical trained rat at the same velocity at week 11 after SCI. C: representation similar to B in a typical untrained rat at the same time point and same velocity. Data from each muscle were recorded transcutaneously. Graphs depict ∼8 s of locomotion.
Fig. 11.
Fig. 11.
Whole body weight and ankle flexor and extensor muscle weight at end of experiment. A: averaged body weight in trained and untrained groups. B: average weight of left TA and gastrocnemius (G) muscles relative to whole body weight at week 11 after SCI is depicted for trained and untrained rats. Data are expressed as means ± SE. ns, Not significant.

References

    1. Alluin O, Delivet-Mongrain H, Gauthier MK, Fehlings MG, Rossignol S, Karimi-Abdolrezaee S. Examination of the combined effects of chondroitinase ABC, growth factors and locomotor training following compressive spinal cord injury on neuroanatomical plasticity and kinematics. PLoS One 9: e111072, 2014. - PMC - PubMed
    1. Alluin O, Karimi-Abdolrezaee S, Delivet-Mongrain H, Leblond H, Fehlings MG, Rossignol S. Kinematic study of locomotor recovery after spinal cord clip compression injury in rats. J Neurotrauma 28: 1963–1981, 2011. - PubMed
    1. Antri M, Barthe JY, Mouffle C, Orsal D. Long-lasting recovery of locomotor function in chronic spinal rat following chronic combined pharmacological stimulation of serotonergic receptors with 8-OHDPAT and quipazine. Neurosci Lett 384: 162–167, 2005. - PubMed
    1. Antri M, Orsal D, Barthe JY. Locomotor recovery in the chronic spinal rat: effects of long-term treatment with a 5-HT2 agonist. In: Spinal Cord Trauma: Regeneration, Neural Repair and Functional Recovery, edited by McKerracher L, Doucet G, Rossignol S. Amsterdam: Elsevier Science, 2002, p. 467–476. - PubMed
    1. Barbeau H, Bédard P. Denervation supersensitivity to 5-HT in rats following spinal transection and 5,7 dihydroxytryptamine injection. Neuropharmacology 20: 611–616, 1981. - PubMed

Publication types

LinkOut - more resources