. 2015 Jul 22;35(29):10460-73.
doi: 10.1523/JNEUROSCI.0045-15.2015.

Functional Oxygen Sensitivity of Astrocytes

Affiliations

Functional Oxygen Sensitivity of Astrocytes

Plamena R Angelova et al. J Neurosci. .

Abstract

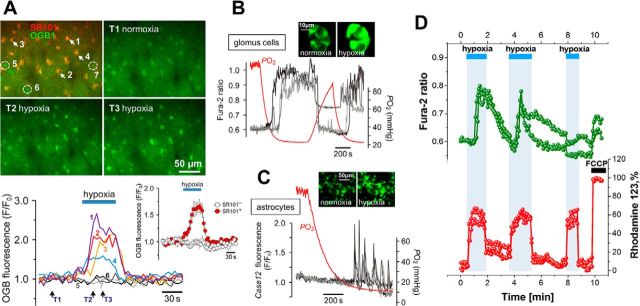
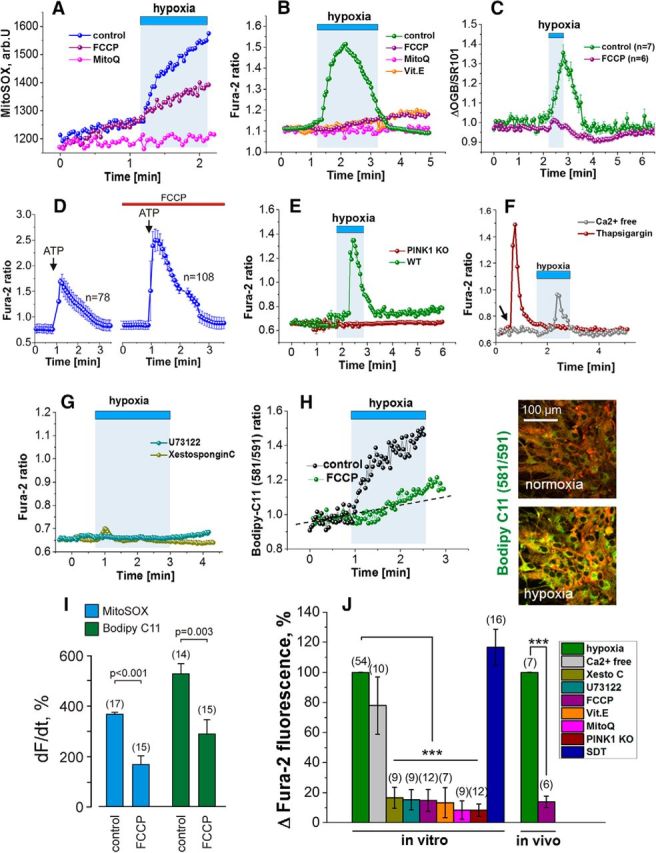
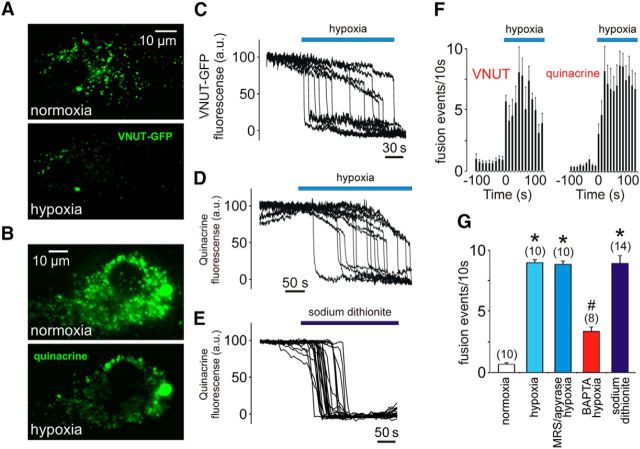
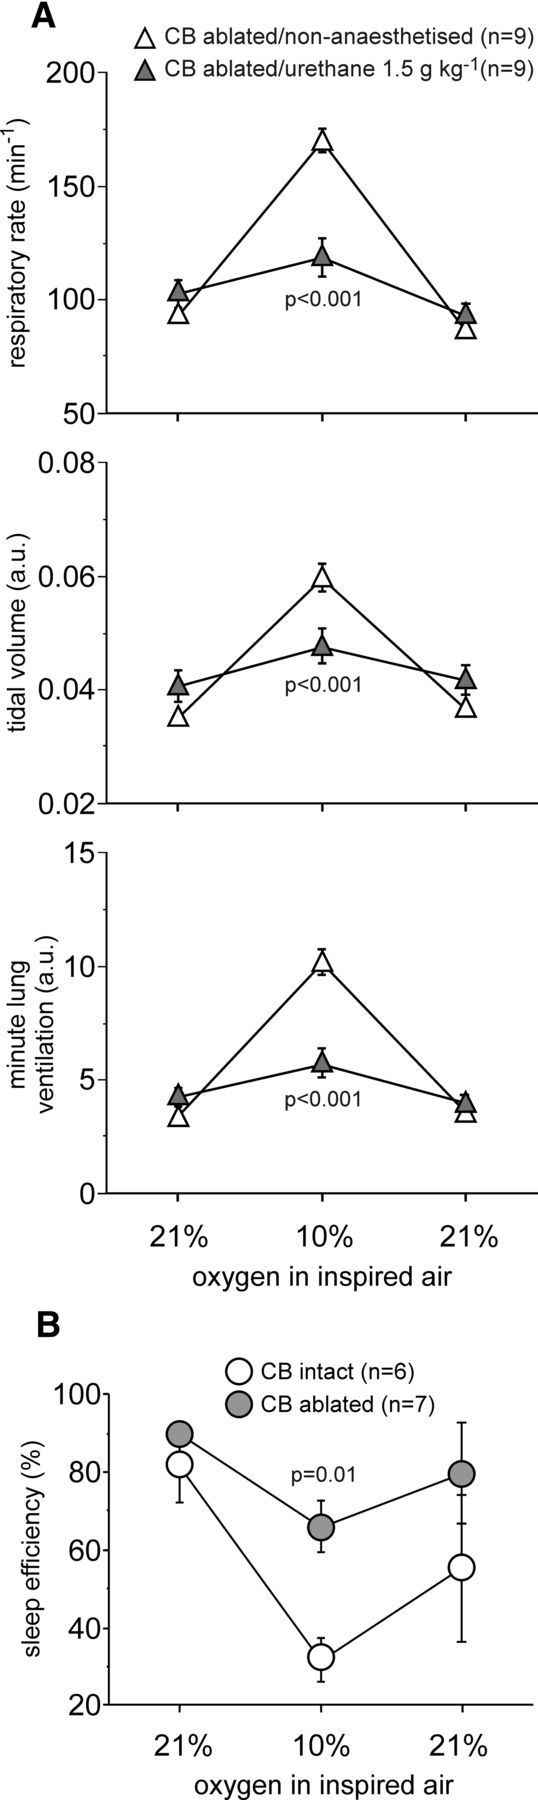
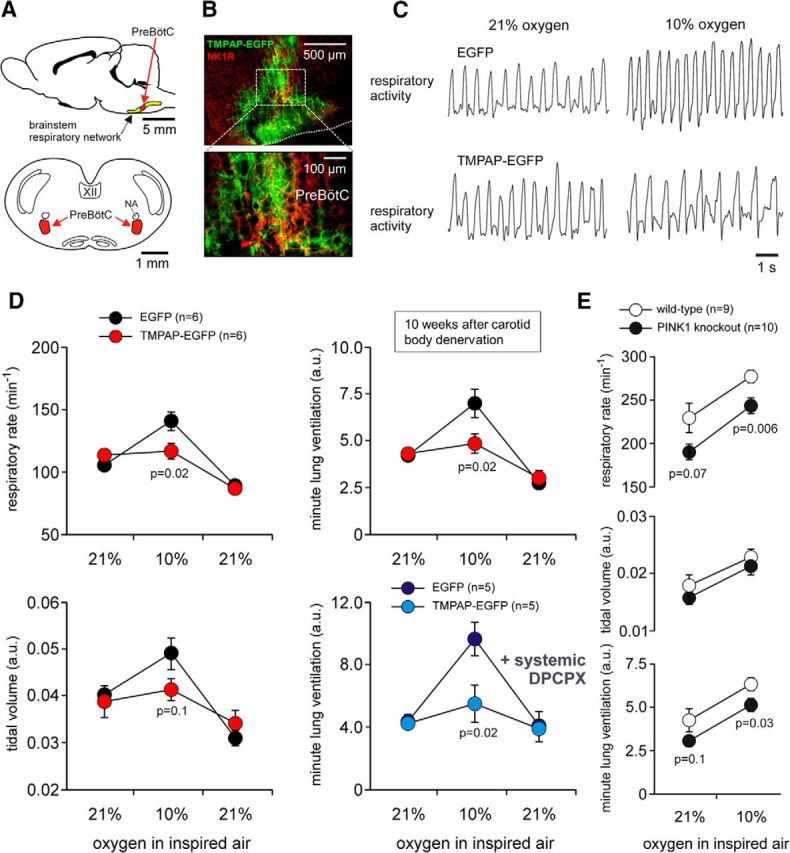
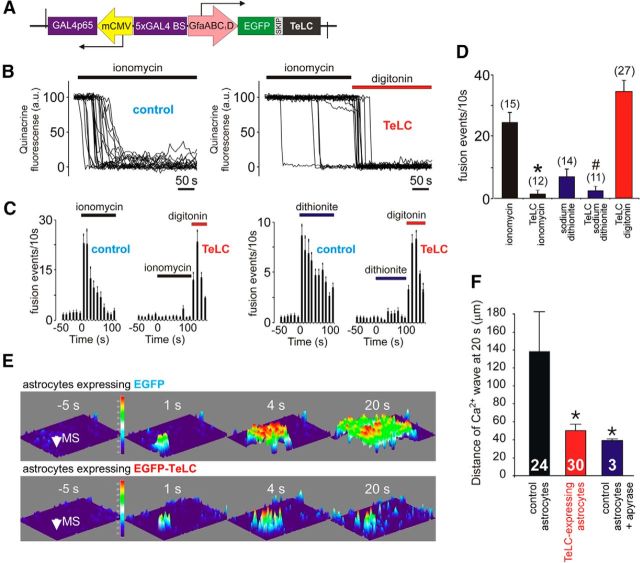
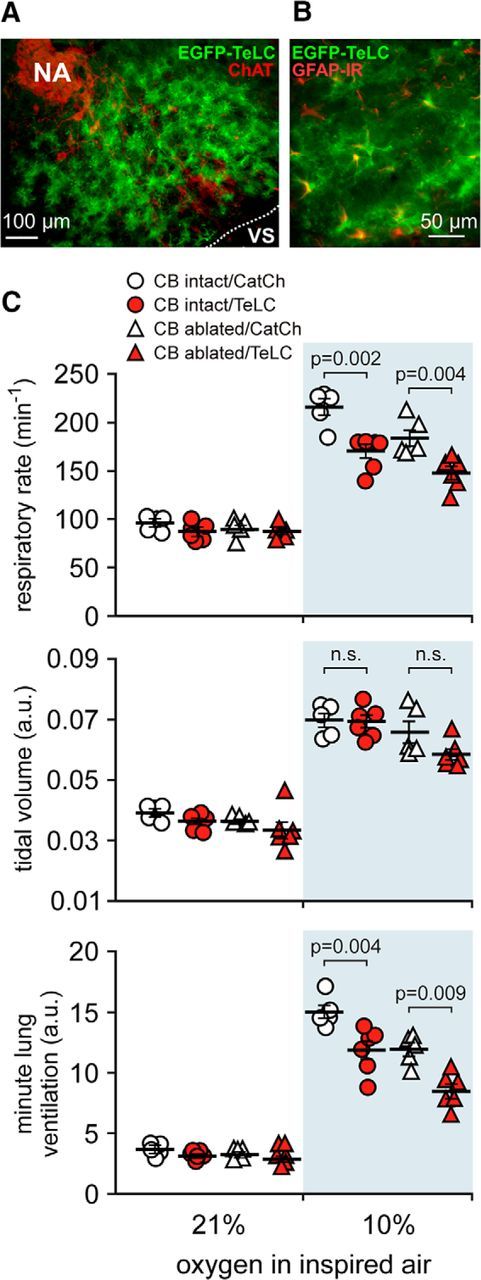
In terrestrial mammals, the oxygen storage capacity of the CNS is limited, and neuronal function is rapidly impaired if oxygen supply is interrupted even for a short period of time. However, oxygen tension monitored by the peripheral (arterial) chemoreceptors is not sensitive to regional CNS differences in partial pressure of oxygen (PO2 ) that reflect variable levels of neuronal activity or local tissue hypoxia, pointing to the necessity of a functional brain oxygen sensor. This experimental animal (rats and mice) study shows that astrocytes, the most numerous brain glial cells, are sensitive to physiological changes in PO2 . Astrocytes respond to decreases in PO2 a few millimeters of mercury below normal brain oxygenation with elevations in intracellular calcium ([Ca(2+)]i). The hypoxia sensor of astrocytes resides in the mitochondria in which oxygen is consumed. Physiological decrease in PO2 inhibits astroglial mitochondrial respiration, leading to mitochondrial depolarization, production of free radicals, lipid peroxidation, activation of phospholipase C, IP3 receptors, and release of Ca(2+) from the intracellular stores. Hypoxia-induced [Ca(2+)]i increases in astrocytes trigger fusion of vesicular compartments containing ATP. Blockade of astrocytic signaling by overexpression of ATP-degrading enzymes or targeted astrocyte-specific expression of tetanus toxin light chain (to interfere with vesicular release mechanisms) within the brainstem respiratory rhythm-generating circuits reveals the fundamental physiological role of astroglial oxygen sensitivity; in low-oxygen conditions (environmental hypoxia), this mechanism increases breathing activity even in the absence of peripheral chemoreceptor oxygen sensing. These results demonstrate that astrocytes are functionally specialized CNS oxygen sensors tuned for rapid detection of physiological changes in brain oxygenation. Significance statement: Most, if not all, animal cells possess mechanisms that allow them to detect decreases in oxygen availability leading to slow-timescale, adaptive changes in gene expression and cell physiology. To date, only two types of mammalian cells have been demonstrated to be specialized for rapid functional oxygen sensing: glomus cells of the carotid body (peripheral respiratory chemoreceptors) that stimulate breathing when oxygenation of the arterial blood decreases; and pulmonary arterial smooth muscle cells responsible for hypoxic pulmonary vasoconstriction to limit perfusion of poorly ventilated regions of the lungs. Results of the present study suggest that there is another specialized oxygen-sensitive cell type in the body, the astrocyte, that is tuned for rapid detection of physiological changes in brain oxygenation.

Keywords: astrocyte; glia; hypoxia; oxygen; respiration.


Figures

Figure 1.
Figure 1.
Astrocytes are sensitive to physiological decreases in PO2. A, In vivo imaging of hypoxia-evoked astrocytic [Ca2+]i responses in somatosensory cortex of an anesthetized adult rat. Top, Pseudocolored images showing changes in OGB-1 fluorescence taken at the times indicated by arrows on the bottom panel. 5–7, Nonresponding cells that were not labeled with SR101. Bottom, Traces showing changes in astrocytic [Ca2+]i in response to hypoxia. Inset, Averaged changes in OGB-1 fluorescence induced by hypoxia in 10 SR101-labeled cells (SR101+) and five neighboring cortical cells that lacked SR101 labeling (SR101) recorded in this experiment. B, Hypoxia-induced [Ca2+]i responses of carotid body glomus cells in culture, visualized using the Ca2+ indicator fura-2 (PO2 threshold of activation, 40 mmHg). Inset, Pseudocolored images of a cluster of glomus cells showing changes in fura-2 fluorescence in response to hypoxia. C, Hypoxia-induced [Ca2+]i responses of brainstem astrocytes (PO2 threshold of activation, 15 mmHg). In this example, astrocytes were identified and their responses to hypoxia were assessed in organotypic brainstem slice using the genetically encoded Ca2+ sensor Case12 expressed under the control of GFAP promoter (Gourine et al., 2010). D, Simultaneous imaging of hypoxia-induced changes in Δψm and [Ca2+]i in cultured brainstem astrocytes using Rh123 and fura-2 showing that mitochondrial depolarization precedes Ca2+ responses. Mitochondrial depolarization is induced by FCCP (1 μm) applied at the end of the experiment to calibrate the Rh123 signal (100%).
Figure 2.
Figure 2.
Mechanisms underlying astroglial Ca2+ responses to decreases in PO2. A, Representative traces of the hypoxia-induced changes in the rate of mitochondrial ROS production in individual astrocytes in culture. Responses are blocked by the mitochondrial ROS scavenger MitoQ or after mitochondrial depolarization induced by FCCP (0.5 μm). B, Hypoxia-induced [Ca2+]i responses in cultured astrocytes are blocked by FCCP (0.5 μm), MitoQ, or vitamin E (α-tocopherol). C, Group data obtained in anesthetized rats illustrating blockade of hypoxia-induced [Ca2+]i responses in cortical astrocytes after application of FCCP (10 μm). D, [Ca2+]i responses in cultured astrocytes induced by P2 receptor activation (ATP, 10 μm) in control conditions and after treatment with FCCP (0.5 μm). E, Hypoxia fails to evoke Ca2+ responses in cultured astrocytes of PINK1 knock-out (KO) mice. WT, Wild-type. F, Cultured astrocytes display Ca2+ responses to hypoxia after removal of external Ca2+, whereas depletion of the ER Ca2+ pools by thapsigargin abolishes the responses. Arrow indicates the time of thapsigargin application. G, Hypoxia fails to evoke Ca2+ responses in cultured astrocytes in the presence of PLC inhibitor (U73122) or IP3 antagonist [Xestospongin C (Xesto C)]. H, Hypoxia increases the rate of lipid peroxidation in cultured astrocytes. Right, Pseudocolored images showing changes in BODIPY 581/591 C11 fluorescence taken before and at the peak of the response induced by hypoxia. I, Summary data illustrating the effect of mitochondrial depolarization induced by FCCP (0.5 μm) on the rate of mitochondrial ROS production (reported by MitoSOX) and lipid peroxidation (reported by BODIPY 581/591 C11) in cultured astrocytes. J, Group data of the pharmacology of Ca2+ responses induced in astrocytes by decreases in PO2, suggesting that hypoxia leads to inhibition of mitochondrial respiration, ROS production, lipid peroxidation, activation of PLC, IP3 receptors, and recruitment of Ca2+ from the intracellular stores. SDT, Sodium dithionite. ***p < 0.001.
Figure 3.
Figure 3.
Hypoxia facilitates exocytosis of ATP-containing vesicular compartments in astrocytes. A, TIRF images of VNUT–GFP-labeled vesicular compartments in cultured astrocytes at resting conditions and during hypoxic challenge. B, TIRF images of quinacrine-labeled vesicular compartments in cultured astrocytes at resting conditions and during hypoxic challenge. C, Plot of the TIRF intensity changes showing hypoxia-induced loss of VNUT–GFP fluorescence from a proportion of labeled organelles in an individual astrocyte. D, Plot of the TIRF intensity changes showing loss of quinacrine fluorescence from a proportion of labeled organelles in an individual astrocyte exposed to hypoxia. E, Plot of the TIRF intensity changes showing loss of quinacrine fluorescence from a proportion of labeled organelles in an individual astrocyte in response to application of the O2 scavenger sodium dithionite. F, Averaged temporal distribution of fusion event frequency detected before and during hypoxia in 10 VNUT–GFP-labeled and 10 quinacrine-loaded brainstem astrocytes. G, Summary data illustrating the peak frequency of hypoxia-induced fusion of ATP-containing compartments recorded in brainstem astrocytes in the absence and presence of MRS2179/apyrase or after 1 h incubation with BAPTA-AM. *p < 0.001 compared with the rate of fusion in normoxia; #p < 0.05 compared with the rate of fusion during hypoxia.
Figure 4.
Figure 4.
Hypoxia-induced respiratory and arousal responses in rats with denervated peripheral oxygen chemoreceptors. A, Summary data illustrating respiratory rate, tidal volume, and minute lung ventilation before, during, and after hypoxia in rats 10 weeks after carotid body (CB) ablation recorded in the non-anesthetized state during QS and under general anesthesia (urethane, 1.5 mg/kg). B, Summary data illustrating changes in SE induced by hypoxia in the carotid body ablated and sham-operated animals (10 weeks after the surgery).
Figure 5.
Figure 5.
Central respiratory oxygen sensitivity is mediated by ATP actions within the brainstem respiratory circuits. A, Schematic drawings of the rat brain in sagittal and coronal projections illustrating the anatomical location of the brainstem respiratory network. NA, Nucleus ambiguus. B, Confocal images of TMPAP–EGFP expression in the respiratory areas of the ventrolateral medulla oblongata centered in (but not limited to) the preBötC, identified by NK-1R immunoreactivity. C, Plethysmography traces illustrating respiratory responses to hypoxia in conscious rats expressing EGFP or TMPAP–EGFP within the brainstem respiratory circuits 10 weeks after peripheral chemodenervation. D, Summary data illustrating changes in the respiratory rate, tidal volume, and minute lung ventilation during and after hypoxia in conscious rats expressing EGFP or TMPAP–EGFP within the brainstem respiratory circuits 10 weeks after peripheral chemodenervation. E, Resting ventilation and ventilatory responses to hypoxia in conscious PINK1-deficient mice and their wild-type counterparts.
Figure 6.
Figure 6.
Blockade of vesicular release mechanisms in astrocytes by virally driven expression of tetanus toxin. A, Schematic of AVV–sGFAP–EGFP–TeLC vector. B, Plots of the TIRF intensity changes showing loss of quinacrine fluorescence from a proportion of labeled organelles in two individual cultured astrocytes transduced to express EGFP (control, left) or TeLC (right) in response to application of a Ca2+ ionophore ionomycin (1 μm). In astrocytes expressing TeLC, digitonin was applied at the end of the experiment to permeabilize the membranes. C, Averaged temporal distribution of ionomycin-induced (left) and sodium dithionite-induced (right) fusion events detected in quinacrine-loaded cultured astrocytes (n = 10 in each group) expressing EGFP or TeLC. D, Summary data illustrating peak frequency of ionomycin- and sodium dithionite-induced fusion events of putative ATP-containing compartments (labeled by quinacrine) detected in cultured astrocytes expressing EGFP (control) or TeLC. *p < 0.001 compared with the rate of fusion induced by ionomycin in control astrocytes. #p = 0.02 compared with the rate of fusion induced by sodium dithionite in control astrocytes. E, TeLC expression inhibits Ca2+ wave propagation induced by mechanical stimulation (MS, indicated by the arrow) in cultured astrocytes. 3D projections of the pixel intensity in the image series obtained before and at indicated time points after mechanical stimulation in astrocyte cultures transduced to express EGFP (top) or EGFP–TeLC (bottom) and loaded with Ca2+ indicator fura-2. F, Bar graph showing the extent of MS-evoked Ca2+ wave propagation (from the point of MS to the front of the wave at 20 s after MS) in control astrocytes, astrocytes expressing TeLC, and naive astrocytes in the presence of the ATP-degrading enzyme apyrase (25 U/ml). Numbers of individual tests are indicated. *p < 0.05.
Figure 7.
Figure 7.
Blockade of vesicular release by brainstem astrocytes impairs central respiratory oxygen sensitivity. A, EGFP–TeLC expression in astrocytes in the brainstem region corresponding to the anatomical location of the preBötC [ventral to the compact formation of the nucleus ambiguus (NA) neurons expressing ChAT]. B, Higher-magnification image of EGFP–TeLC expression (green) in astrocytes of the preBötC region. IR, Immunoreactivity. C, Summary data illustrating hypoxia-induced changes in the respiratory rate, tidal volume, and minute lung ventilation in carotid body intact and peripherally chemodenervated (10 weeks) conscious rats expressing CatCh (calcium translocating channelrhodopsin variant that was fused with EGFP and used as a control here) or TeLC within the brainstem respiratory circuits.

References

    1. Abramov AY, Scorziello A, Duchen MR. Three distinct mechanisms generate oxygen free radicals in neurons and contribute to cell death during anoxia and reoxygenation. J Neurosci. 2007;27:1129–1138. doi: 10.1523/JNEUROSCI.4468-06.2007. - DOI - PMC - PubMed
    1. Aley PK, Murray HJ, Boyle JP, Pearson HA, Peers C. Hypoxia stimulates Ca2+ release from intracellular stores in astrocytes via cyclic ADP ribose-mediated activation of ryanodine receptors. Cell Calcium. 2006;39:95–100. doi: 10.1016/j.ceca.2005.09.009. - DOI - PubMed
    1. Araque A, Carmignoto G, Haydon PG, Oliet SH, Robitaille R, Volterra A. Gliotransmitters travel in time and space. Neuron. 2014;81:728–739. doi: 10.1016/j.neuron.2014.02.007. - DOI - PMC - PubMed
    1. Attwell D, Buchan AM, Charpak S, Lauritzen M, Macvicar BA, Newman EA. Glial and neuronal control of brain blood flow. Nature. 2010;468:232–243. doi: 10.1038/nature09613. - DOI - PMC - PubMed
    1. Bisgard GE, Forster HV, Klein JP. Recovery of peripheral chemoreceptor function after denervation in ponies. J Appl Physiol Respir Environ Exerc Physiol. 1980;49:964–970. - PubMed

Publication types

LinkOut - more resources