. 2015 Jul 22;35(29):10523-34.
doi: 10.1523/JNEUROSCI.3375-14.2015.

Retinal and Tectal "Driver-Like" Inputs Converge in the Shell of the Mouse Dorsal Lateral Geniculate Nucleus

Affiliations

Retinal and Tectal "Driver-Like" Inputs Converge in the Shell of the Mouse Dorsal Lateral Geniculate Nucleus

Martha E Bickford et al. J Neurosci. .

Abstract

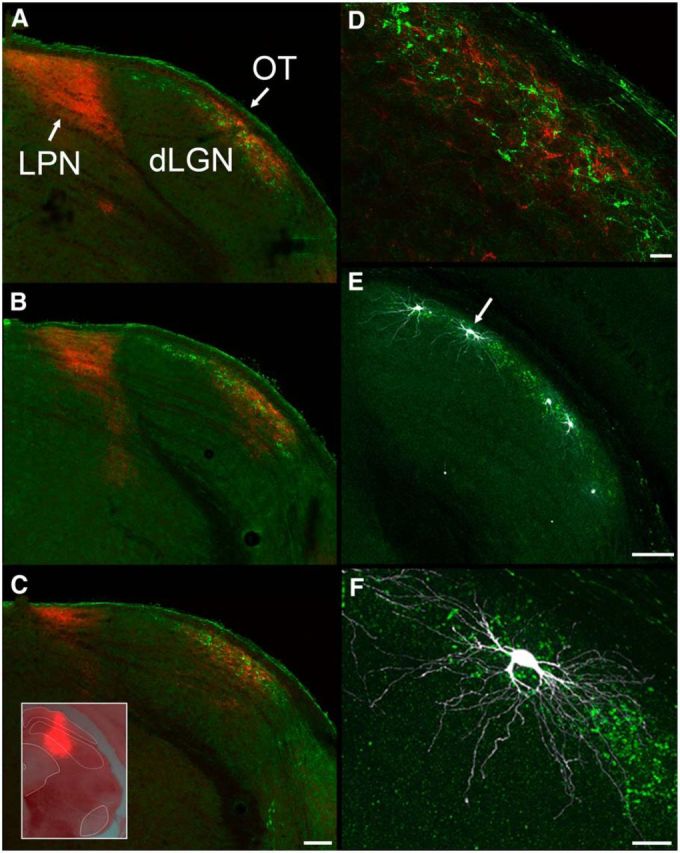
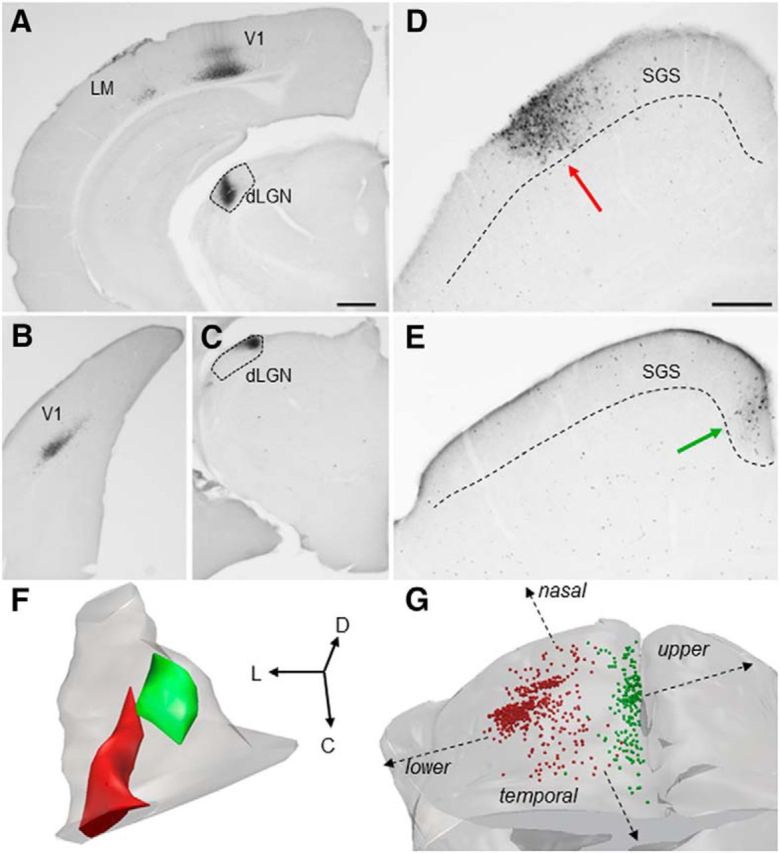
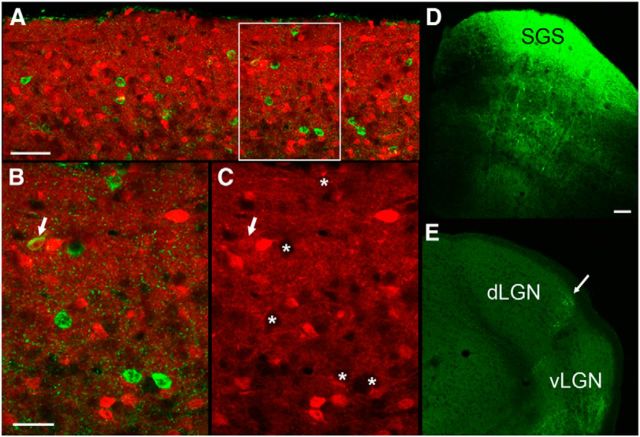
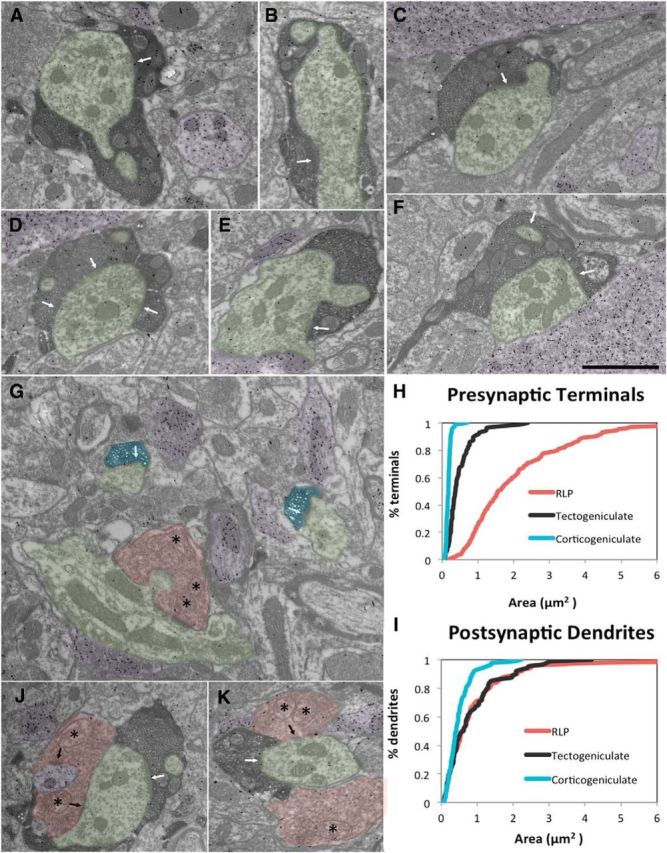
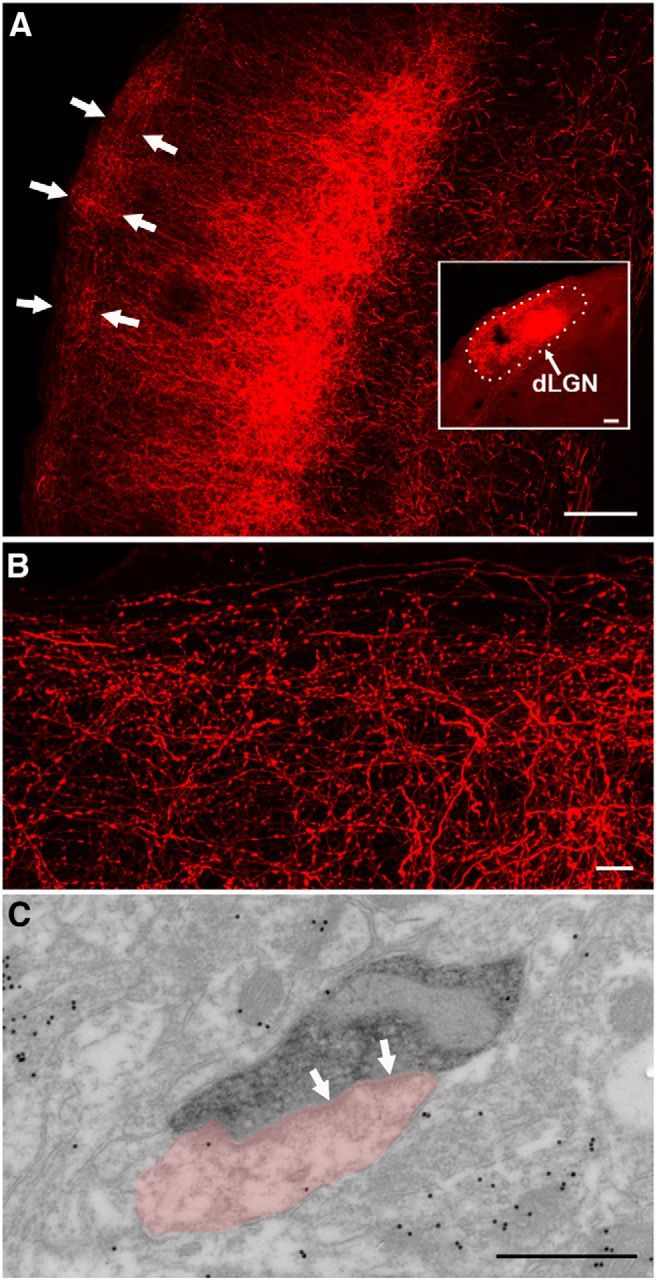
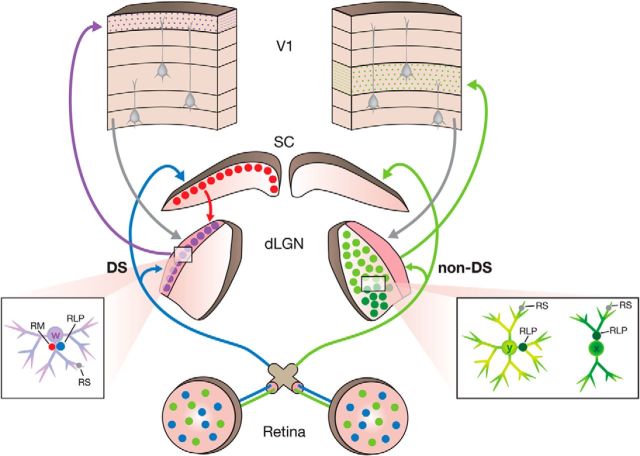
The dorsal lateral geniculate nucleus (dLGN) is a model system for understanding thalamic organization and the classification of inputs as "drivers" or "modulators." Retinogeniculate terminals provide the primary excitatory drive for the relay of information to visual cortex (V1), while nonretinal inputs act in concert to modulate the gain of retinogeniculate signal transmission. How do inputs from the superior colliculus, a visuomotor structure, fit into this schema? Using a variety of anatomical, optogenetic, and in vitro physiological techniques in mice, we show that dLGN inputs from the superior colliculus (tectogeniculate) possess many of the ultrastructural and synaptic properties that define drivers. Tectogeniculate and retinogeniculate terminals converge to innervate one class of dLGN neurons within the dorsolateral shell, the primary terminal domain of direction-selective retinal ganglion cells. These dLGN neurons project to layer I of V1 to form synaptic contacts with dendrites of deeper-layer neurons. We suggest that tectogeniculate inputs act as "backseat drivers," which may alert shell neurons to movement commands generated by the superior colliculus. Significance statement: The conventional view of the dorsal lateral geniculate nucleus (dLGN) is that of a simple relay of visual information between the retina and cortex. Here we show that the dLGN receives strong excitatory input from both the retina and the superior colliculus. Thus, the dLGN is part of a specialized visual channel that provides cortex with convergent information about stimulus motion and eye movement and positioning.

Keywords: corticogeniculate; frequency dependent depression; optogenetics; retinogeniculate; tectogeniculate; ultrastructure.


Figures

Figure 1.
Figure 1.
A–F, Components of the dLGN dorsolateral shell. In TRHR mice, in which GFP is expressed in direction-selective retinogeniculate terminals (green), virus injections were placed in the SC (C, inset) to induce the expression of TdTomato in tectothalamic terminals (red). A caudal (A) to rostral (C) series of sections illustrates the overlap of tectogeniculate and TRHR retinogeniculate terminals in the dorsolateral shell of the dLGN (also shown at higher magnification in D). Cells filled with biocytin in TRHR animals exhibit W-cell morphology (E; arrow indicates cell shown at higher magnification in F). Scale bars: C (for A–C), E, 100 μm; D, 20 μm; F, 25 μm.
Figure 2.
Figure 2.
A–G, TG topography. Small iontophoretic injections of CTB in the lateral dLGN (A, coronal section; F, 3D reconstruction of dLGN, red) labeled corticogeniculate cells in layer VI of rostral V1 and the lateromedial (LM) cortex (A) and TG cells in the lateral SGS of the SC (D, coronal section, red arrow; G, 3D distribution, red dots). Small iontophoretic injections of CTB in the medial dLGN (C, coronal section; F, 3D reconstruction of dLGN, green) labeled corticogeniculate cells in layer VI of caudal V1 (B) and TG cells in the medial SGS (E, coronal section, green arrow; G, 3D distribution, green dots). Based on the SC receptive field positions mapped by Dräger and Hubel (1976), TG projections to the medial and lateral dLGN likely represent upper and visual fields, respectively (schematically indicated in G). Scale bars: (in A) A–C, 500 μm; (in D) D, E, 250 μm Orientation of 3D reconstructions in F and G is indicated by arrows. D, Dorsal; L, lateral; C, caudal.
Figure 3.
Figure 3.
A–E, Tectogeniculate projections are primarily non-GABAergic. Injections of CTB-488 were inotophoretically injected into the dLGN of GAD2-cre mice crossed with Ai9 reporter mice. These injections labeled cells in the SGS (A, confocal 6 μm optical image) by retrograde transport (green cells) that were largely nonoverlapping with the population of GABAergic neurons labeled with tdTomato (red cells). The rectangle in A indicates the region shown in 2 μm optical images at higher magnification in B (CTB and tdTomato-labeled cells) and C (tdTomato only). Most CTB-labeled neurons did not contain tdTomato (asterisks), but tdTomato could be detected in 5% of CTB-labeled cells (e.g., cell indicated by the arrows). Large injections of cre-dependent virus into the SC of GAD2-cre mice (D, pseudocolored green) labeled sparse projections in the dLGN (E, green). Scale bars: A, 50 μm; (in B) B, C, 25 μm; (in D) D, E, 100 μm.
Figure 4.
Figure 4.
A–K, Ultrastructure of TG terminals. TG terminals (dark reaction product, A–F, J, K) are significantly larger than CG terminals (G, blue) and significantly smaller than retinogeniculate terminals (G, J, K, red), identified by their pale mitochondria (asterisks) as RLP profiles. The cumulative distribution of terminals sizes is illustrated in H. RLP, TG, and CG terminals primarily contact (arrows) non-GABAergic relay cell dendrites (green). GABAergic profiles are identified by a high density of overlying gold particles (purple; A, CK). The cumulative distribution of postsynaptic dendrite sizes is illustrated in I. CG terminals contact dendrites that are significantly smaller than the dendrites contacted by TG and RLP terminals. RLP and TG converge to innervate larger caliber dendrites (J, K). Scale bar: (in F) A–G, J, K, 1 μm.
Figure 5.
Figure 5.
Light-evoked TG responses. A, Confocal image of a coronal section of the dorsal lateral shell of the dLGN depicting a W-like biocytin-filled relay neuron (green) and tectogeniculate axons (red) expressing tdTomato following a virus injection in the SC. B, Whole-cell,current-clamp recording showing large postsynaptic excitatory responses of a dLGN cell evoked by blue light stimulation (200 ms pulse) of tectogeniculate terminals expressing ChIEF. Responses were recorded at different holding potentials. C, Optically evoked postsynaptic responses of the same cell before and during bicuculline (Bic; 25 μm), AP5 (50 μm), and DNQX (10 μm) application. Bic and AP5 had little to no effect on synaptic response, whereas DNQX application completely abolished it. D, A similar effect could be observed when the cell was stimulated by a train of light pulses (20 pulses at 10 Hz).
Figure 6.
Figure 6.
Synaptic depression of TG responses. A, Top, Representative voltage-clamp recording of postsynaptic responses in dLGN evoked by paired-pulse light stimulation (100 ms interstimulus interval) of ChIEF expressing SC terminals (average of 10 responses). Bottom, Summary plot depicting the paired-pulse ratio (EPSC2/EPSC1) for 15 relay cells evoked by the same stimulus conditions. Gray symbols represent PPR of individual cells and the black symbol represents the mean and SEM. PPRs reflect strong synaptic depression. B, Top, Representative recording showing TG synaptic responses evoked by a 20 Hz train of light (average of 10 responses). Bottom, Summary plot showing the degree of depression of light evoked EPSCs as a function of stimulus number for 12 neurons. To calculate depression percentage, the amplitude of the nth response was divided by the first response and multiplied by 100. Error bars indicate SEM.
Figure 7.
Figure 7.
Functional convergence of TG and RG inputs. A, Top, Schematic diagram showing whole-cell recordings from a dLGN relay neuron following electrical stimulation of RG axons in the optic tract and photostimulation of TG terminals in the dorsolateral shell. Beneath are EPSCs recorded in a single cell evoked by repetitive activation (20 Hz) of RG (red traces) and TG (black traces) inputs. Both sets of responses showed synaptic depression. Red and blue ticks indicate corresponding stimulus protocols. Inset, Expanded traces of the first two RG (red) and TG (black) responses under control conditions. Superimposed gray traces depict responses following bath application of DNQX and CPP; these glutamate receptor antagonists abolished both sets of responses. B, Example RG (red) and TG (black) EPSCs evoked by paired-pulse stimuli (50 and 500 ms interstimulus intervals). C, Summary plot showing the mean and SEM (n = 6) of PPRs for RG (red) and TG (black) EPSCs at 50 and 500 ms interstimulus intervals. At 50 ms, the TG PPR was smaller, indicating greater synaptic depression. *p < 0.001.
Figure 8.
Figure 8.
Tectorecipient dLGN neurons project to V1 layer I. A–C, CTB-488-infused filter paper applied to layer I of V1 (A) paired with viral vector injections in the SC (B) resulted in the retrograde labeling of dLGN cells (C, green) in regions of the dLGN innervated by tectal terminals (C, red). D, E, CTB-labeled cells (D, green) filled with biocytin (red) responded to photoactivation of surrounding tectogeniculate terminals with large-amplitude EPSCs that exhibited frequency-dependent depression (E). LPN, Lateral posterior nucleus. Scale bars: A–C, 100 μm; D, 20 μm.
Figure 9.
Figure 9.
Synaptic targets of dLGN projections to V1 layer I. A, B, Injections of BDA in the dLGN (A, inset) labeled terminals that were distributed primarily in layer IV of V1 (A), but also innervated layer I of V1 (A, arrows; B). C, Electron microscopic analysis of BDA-labeled geniculocortical terminals in layer I of V1 indicated that the majority (98%) of these terminals contact (arrows) non-GABAergic dendrites (pink). LPN, Lateral posterior nucleus. Scale bars: A, inset, 100 μm; B, 10 μm; C, 0.5 μm.
Figure 10.
Figure 10.
Distinct functional circuits in the dLGN core and shell. The summary diagram depicts the circuits of the dLGN shell revealed in the current study on the left side, and the circuits of the dLGN core revealed in previous studies on the right side. The core contains cells that display “X-like” and “Y-like” morphology (Krahe et al., 2011). These neurons receive input from V1 (gray, RS) on their distal dendrites and input from non-direction-selective (non-DS) retinal ganglion cells (green, RLP) on their proximal dendrites, which drive center-surround receptive field properties (Huberman et al., 2008; Bickford et al., 2010; Kim et al., 2010; Kay et al., 2011; Piscopo et al., 2013). Core cells project to layer IV of VI (Cruz-Martín et al., 2014). The shell contains cells that display “W-like” morphology. Like core neurons, shell neurons receive input from the cortex (gray, RS) on their more distal dendrites, but their proximal dendrites are innervated by convergent input from direction-selective (DS) retinal ganglion cells (blue, RLP; Cruz-Martín et al., 2014), as well as the superior colliculus (red, RM). Presumably, the integration of DS retinal and SC inputs underlies emergent direction-selective properties of dorsolateral shell neurons (Marshel et al., 2012; Piscopo et al., 2013; Scholl et al., 2013; Zhao et al., 2013). Shell neurons project to layer I [current results as well as those of Cruz-Martín et al. (2014)], where they contact the dendrites of non-GABAergic pyramidal cells.

References

    1. Anderson JC, da Costa NM, Martin KA. The W cell pathway to cat primary visual cortex. J Comp Neurol. 2009;516:20–35. doi: 10.1002/cne.22085. - DOI - PubMed
    1. Baldauf ZB, Wang XP, Wang S, Bickford ME. Pretectotectal pathway: an ultrastructural quantitative analysis in cats. J Comp Neurol. 2003;464:141–158. doi: 10.1002/cne.10792. - DOI - PubMed
    1. Baldauf ZB, Chomsung RD, Carden WB, May PJ, Bickford ME. Ultrastructural analysis of projections to the pulvinar nucleus of the cat. I: Middle suprasylvian gyrus (areas 5 and 7) J Comp Neurol. 2005a;485:87–107. doi: 10.1002/cne.20480. - DOI - PMC - PubMed
    1. Baldauf ZB, Wang S, Chomsung RD, May PJ, Bickford ME. Ultrastructural analysis of projections to the pulvinar nucleus of the cat. II: Pretectum. J Comp Neurol. 2005b;485:108–126. doi: 10.1002/cne.20487. - DOI - PMC - PubMed
    1. Bickford ME, Ramcharan E, Godwin DW, Erişir A, Gnadt J, Sherman SM. Neurotransmitters contained in the subcortical extraretinal inputs to the monkey lateral geniculate nucleus. J Comp Neurol. 2000;424:701–717. doi: 10.1002/1096-9861(20000904)424:4&lt%3B701::AID-CNE11&gt%3B3.0.CO%3B2-B. - DOI - PubMed

Publication types

LinkOut - more resources