. 2015 Sep 4;290(36):21876-89.
doi: 10.1074/jbc.M115.657957. Epub 2015 Jul 22.

Finerenone Impedes Aldosterone-dependent Nuclear Import of the Mineralocorticoid Receptor and Prevents Genomic Recruitment of Steroid Receptor Coactivator-1

Affiliations

Finerenone Impedes Aldosterone-dependent Nuclear Import of the Mineralocorticoid Receptor and Prevents Genomic Recruitment of Steroid Receptor Coactivator-1

Larbi Amazit et al. J Biol Chem. .

Abstract

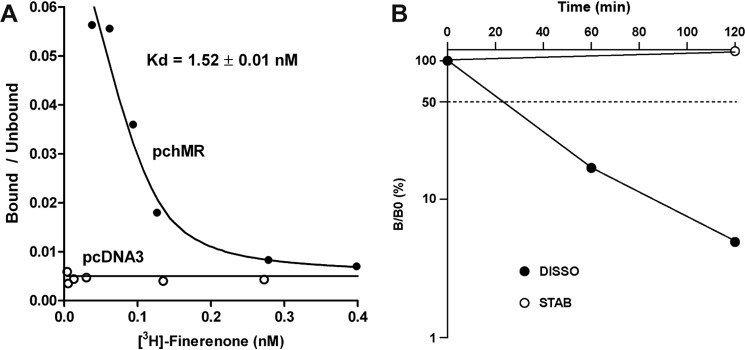
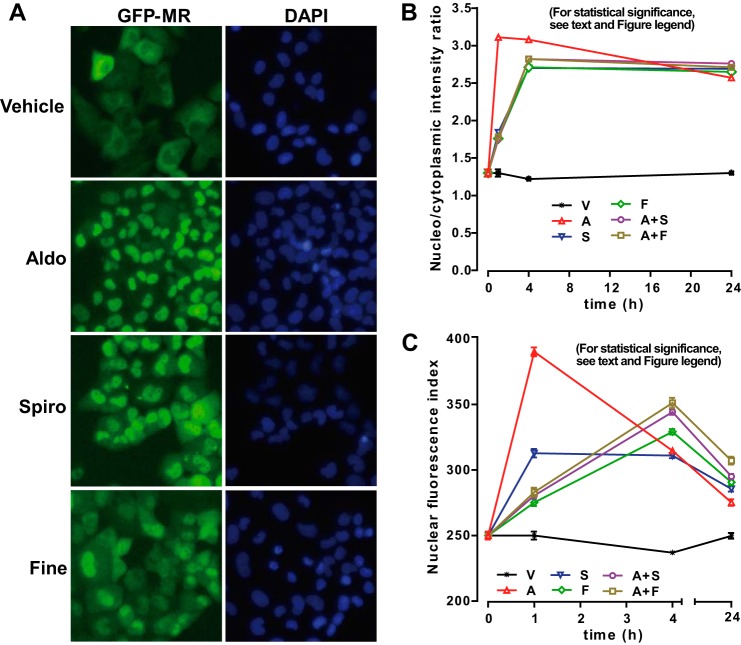
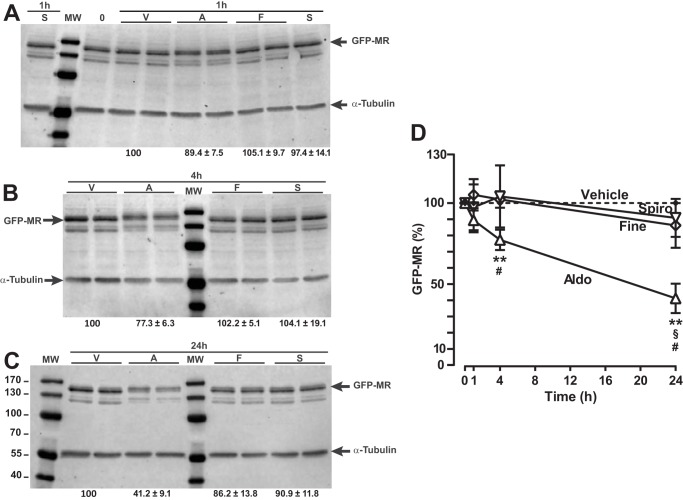
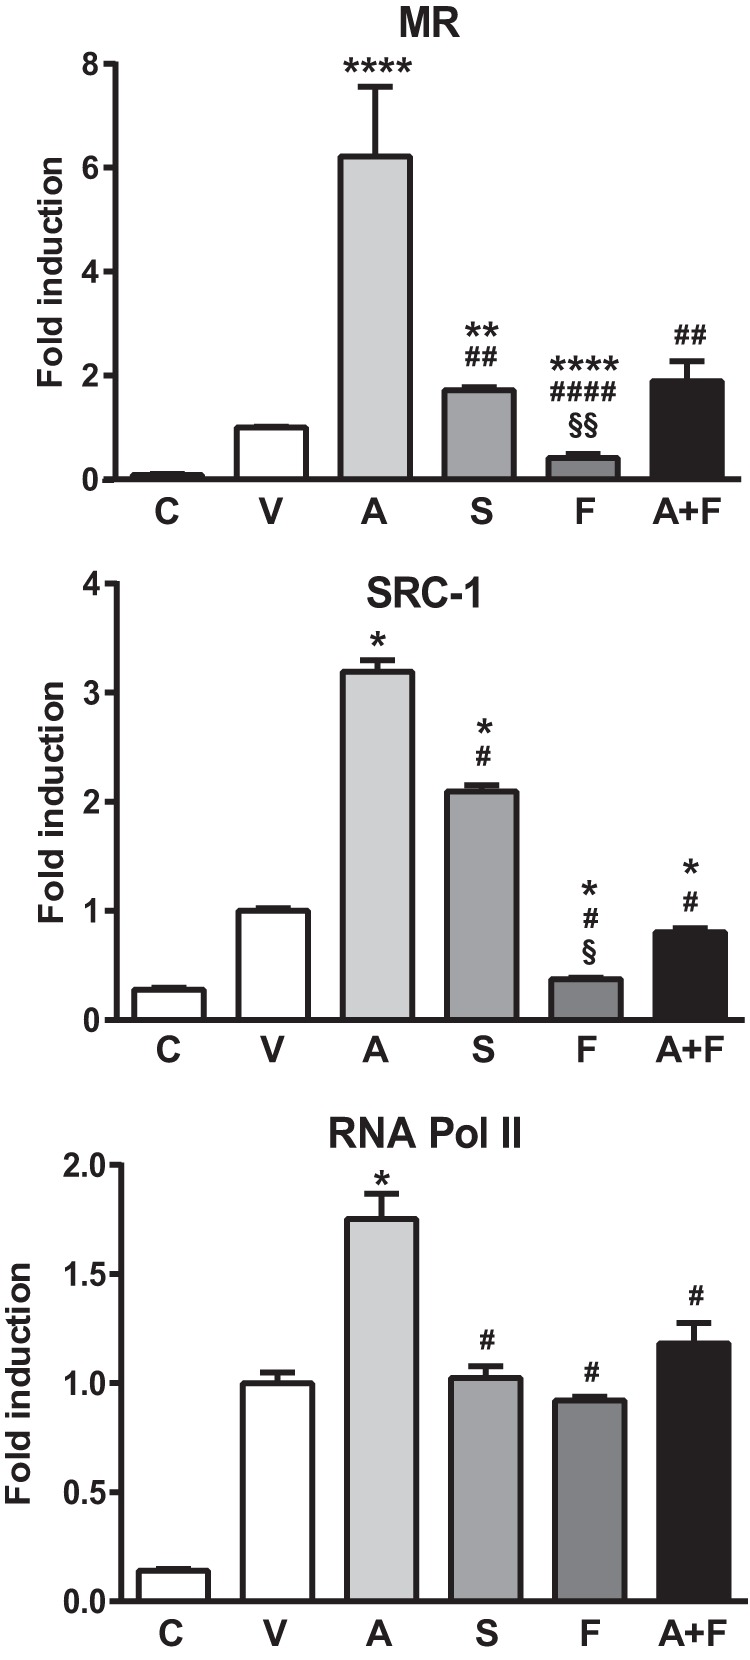
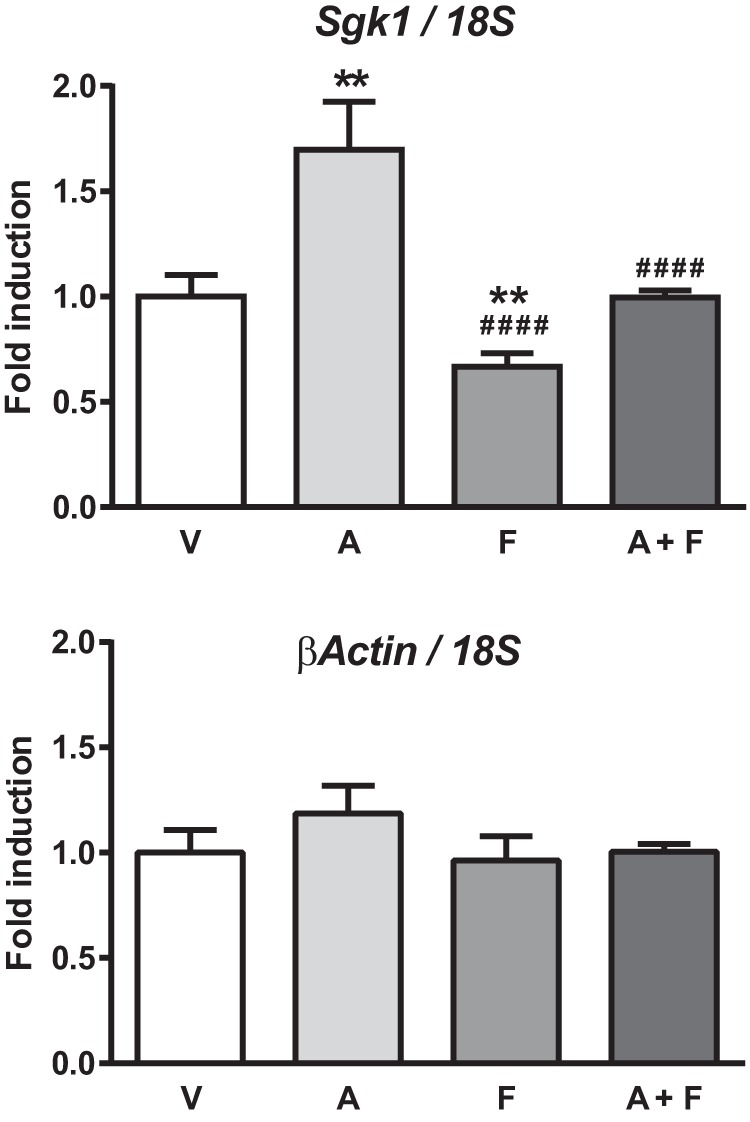
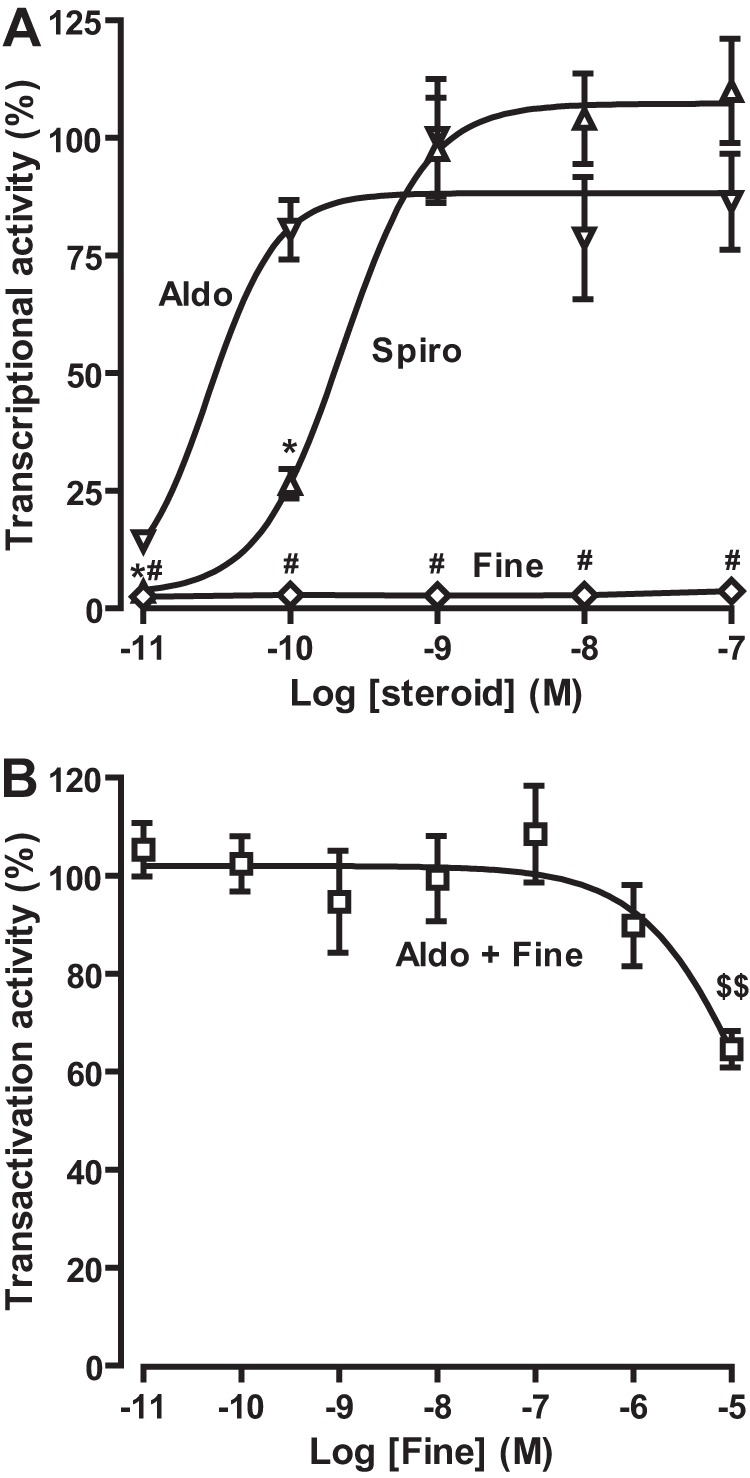
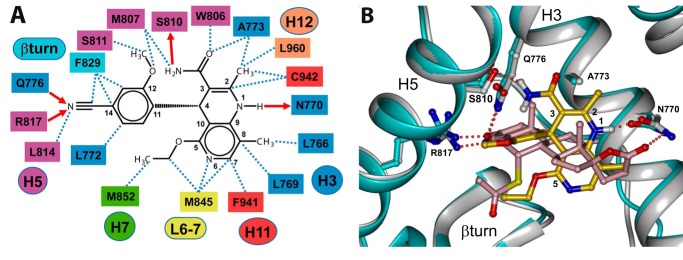
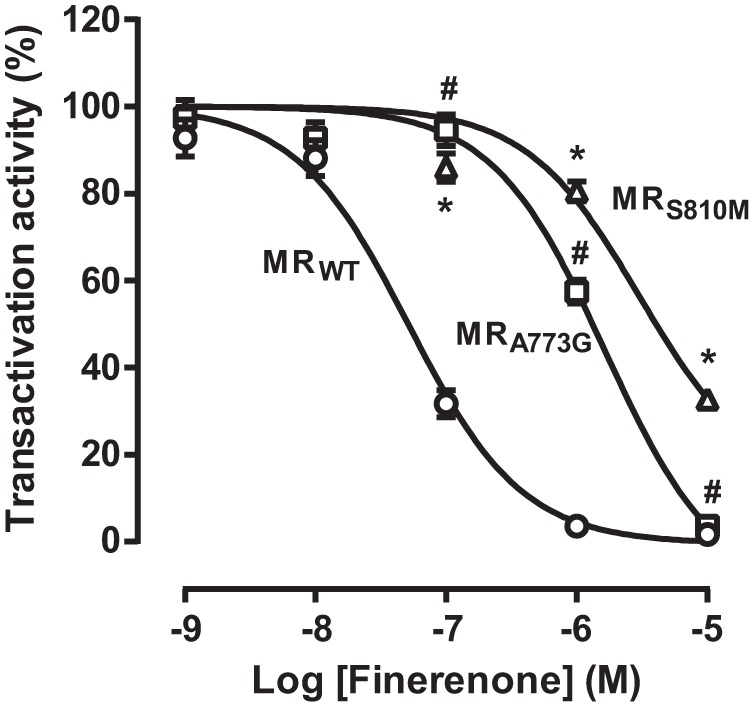
Aldosterone regulates sodium homeostasis by activating the mineralocorticoid receptor (MR), a member of the nuclear receptor superfamily. Hyperaldosteronism leads todeleterious effects on the kidney, blood vessels, and heart. Although steroidal antagonists such as spironolactone and eplerenone are clinically useful for the treatment of cardiovascular diseases, they are associated with several side effects. Finerenone, a novel nonsteroidal MR antagonist, is presently being evaluated in two clinical phase IIb trials. Here, we characterized the molecular mechanisms of action of finerenone and spironolactone at several key steps of the MR signaling pathway. Molecular modeling and mutagenesis approaches allowed identification of Ser-810 and Ala-773 as key residues for the high MR selectivity of finerenone. Moreover, we showed that, in contrast to spironolactone, which activates the S810L mutant MR responsible for a severe form of early onset hypertension, finerenone displays strict antagonistic properties. Aldosterone-dependent phosphorylation and degradation of MR are inhibited by both finerenone and spironolactone. However, automated quantification of MR subcellular distribution demonstrated that finerenone delays aldosterone-induced nuclear accumulation of MR more efficiently than spironolactone. Finally, chromatin immunoprecipitation assays revealed that, as opposed to spironolactone, finerenone inhibits MR, steroid receptor coactivator-1, and RNA polymerase II binding at the regulatory sequence of the SCNN1A gene and also remarkably reduces basal MR and steroid receptor coactivator-1 recruitment, unraveling a specific and unrecognized inactivating mechanism on MR signaling. Overall, our data demonstrate that the highly potent and selective MR antagonist finerenone specifically impairs several critical steps of the MR signaling pathway and therefore represents a promising new generation MR antagonist.

Keywords: aldosterone; antagonist; cardiovascular disease; drug action; heart; inhibition mechanism; inhibitor; mechanism of action; mineralocorticoid receptor; steroid hormone receptor.


Figures

FIGURE 1.
FIGURE 1.
Finerenone binding characteristics at equilibrium and kinetic experiments. A, the human MR was expressed in vitro in the rabbit reticulocyte lysate system. Lysates were diluted 4-fold with TEGWM buffer (20 mm Tris-HCl, 1 mm EDTA, 20 mm sodium tungstate, 1 mm β-mercaptoethanol, and 10% glycerol (v/v), pH 7.4) and incubated with 3 × 10⁻¹⁰ to 3 × 10⁻⁷ [3H]finerenone for 4 h at 4 °C. Bound (B) and Unbound (U) ligands were separated by the dextran-charcoal method. The change in B/U as a function of B was analyzed, and the Kd value was calculated. B, dissociation kinetics studies were performed using 4-fold diluted hMR containing lysates incubated with 10−8 m [3H]finerenone for 4 h at 4 °C. One-half of the labeled lysate was kept at 4 °C and used to determine the stability of the [3H]finerenone-MR complexes, whereas the other half was incubated with 10−6 m finerenone for various periods of time. Bound and free ligands were separated using charcoal-dextran treatment. The data were corrected for receptor stability and were expressed as percentages of the binding measured at time 0.
FIGURE 2.
FIGURE 2.
Finerenone and spironolactone delay the ligand-induced nuclear translocation of the mineralocorticoid receptor. A, HK-GFP-MR cells were cultured for 48 h in medium containing 2.5% charcoal-stripped fetal bovine serum, followed by 1 h of incubation with either 10−8 m aldosterone, 10−6 m finerenone, or spironolactone. Cells were processed for immunocytochemistry using an anti-GFP antibody, and fluorescence was captured with an automated ArrayScan VTI fluorescent microscope. DAPI staining delineates the nuclei. The left panel shows the raw images acquired in the GFP channel. The right panel shows the DAPI acquisition. B, automated quantification of GFP-hMR nuclear translocation kinetics by automated high throughput microscopy. HK-GFP-MR cells were cultured in medium containing 2.5% charcoal-stripped fetal bovine serum. Forty-eight hours after, cells were treated with either 10−8 m aldosterone, 10−6 m finerenone, or 10−6 m spironolactone or incubated with a mix of aldosterone 10−8 m and antagonist at 10−6 m for 1, 4, or 24 h as indicated. The panel shows the translocation index that represents the ratio of the average nuclear intensity to the average cytoplasmic intensity (NI/CI) calculated in their respective binary mask (see “Experimental Procedures”). C, the panel shows the average nuclear fluorescence intensity (NI) values calculated for each indicated condition (CircAvgInten). Statistical significance was calculated with the Mann-Whitney nonparametric U test with unpaired data and two-tailed calculations. Because of the very large number of cells (3,000–12,000), p values < 0.0001 were obtained, with some exceptions. For the NI/CI, p values < 0.001 were obtained for S versus A+F (1 h), S versus F (24 h), S versus A+S (24 h), and F versus A+F (24 h), p values < 0.01 for F versus A+F (1 h) and A versus S (4 h); p values < 0.05 for F versus A+S (1 h) and A+F versus A+S (24 h), and nonsignificant values were obtained for A+F versus A+S (1 h), S versus A+S (4 h), and S versus A+F (24 h). For the NI, p values < 0.001 were obtained for S versus A+S (24 h), and p values < 0.01 were obtained for A versus S (4 h) and F versus A+F (24 h); nonsignificant values were obtained for F versus A+S (1 h), A versus V (24 h), and S versus F (24 h), F versus A+S (24 h), and A+S versus A+F (24 h).
FIGURE 3.
FIGURE 3.
GFP-MR degradation upon ligand binding. A, Western blot analysis of the ligand-induced degradation of the GFP-hMR fusion protein. A–C, HK-GFP-MR cells were treated for 1 h (A), 4 h (B), or 24 h (C) with vehicle (V), 10−8 m aldosterone (A), 10−6 m spironolactone (S), or finerenone (F). The upper bands, corresponding to the GFP-hMR fusion protein (150 kDa), were revealed by the 39N antibody directed toward MR and quantified with the Image Studio software. The values were normalized with those of the α-tubulin bands (55 kDa) and by the values for the vehicle conditions. The values are reported under each corresponding lanes and are the means ± S.E. of three independent experiments with 1–4 measurements. D, GFP-hMR time course degradation. Statistical significance was calculated with the Mann-Whitney nonparametric U tests with unpaired data and two-tailed calculations. * (aldosterone versus vehicle), # (aldosterone versus finerenone), and § (aldosterone versus spironolactone), p < 0.05; **, p < 0.01.
FIGURE 4.
FIGURE 4.
MR, SRC-1, and RNA Pol II recruitment on the promoter region of the SCNN1A gene. HK-GFP-MR cells were incubated with ethanol (V), 10−7 m aldosterone (A), 10−6 m spironolactone (S), or finerenone (F) or 10−7 m aldosterone plus 10−6 m finerenone (A+F), fixed with paraformaldehyde, lysed, and chromatin-sheared. Samples were then immunoprecipitated with the anti-MR 39N antibody or a control rabbit IgG (C) (top panel), SRC-1 (middle panel), or an antibody directed against the RNA Pol II (bottom panel) as described under “Experimental Procedures.” After elution, DNA was quantified by quantitative PCR, using primers for the genomic fragment encompassing mineralocorticoid responsive element corresponding to the MR binding site located in the promoter region of the SCNN1A gene. The results are expressed as percentages of input before immunoprecipitation. The data are means ± S.E. of three independent experiments. Statistical significance was calculated with the Mann-Whitney nonparametric U tests with unpaired data and two-tailed calculations. **** (versus vehicle), #### (versus aldosterone), and §§§§ (versus spironolactone), p < 0.0001; ***, ###, and §§§, p < 0.001; **, ##, and §§, p < 0.01; *, #, and §, p < 0.05.
FIGURE 5.
FIGURE 5.
Aldosterone-induced transcriptional activation of the Sgk1 gene. KC3AC1 cells were treated for 4 h with vehicle (V), 10−8 m aldosterone (A), 10−6 m finerenone alone (F), or finerenone in the presence of 10−8 m aldosterone (A+F). Total RNAs were isolated and reverse transcribed. cDNAs for Sgk1 and β-actin were quantified by real time quantitative PCR, using a specific primer pairs. Relative gene expression values were normalized to that of 18S rRNA and expressed as fold induction compared with vehicle condition arbitrarily set at 1. The data are means ± S.E. of six independent determinations performed in duplicate. Statistical significance were calculated with Mann-Whitney nonparametric U tests with unpaired data and two-tailed calculations. **, p < 0.01 versus vehicle; ####, p < 0.0001 versus aldosterone.
FIGURE 6.
FIGURE 6.
Finerenone inhibits the aldosterone-induced transactivation activity of MRS810L. HEK 293T cells transiently expressing MRS810L were incubated for 16 h with increasing concentrations aldosterone, finerenone, or spironolactone (A) or 10−9 m aldosterone in the presence of increasing concentrations of finerenone (B). The activity of MRS810L to transactivate the luciferase gene, which is under the control of a glucocorticoid response element-containing promoter, was determined by measuring the luciferase activity, which was then normalized to the β-galactosidase activity and to the value obtained with 10−9 m aldosterone. The values are means ± S.E. of at least three independent experiments performed in triplicate. GraphPad Prism software was used to fit the curves and to calculate the EC50 and IC50 values. The data are means ± S.E. of three to four independent experiments performed in sextuplet. Statistical significance were calculated with the Mann-Whitney nonparametric U tests with unpaired data and two-tailed calculations. * (spironolactone versus aldosterone) and # (finerenone versus aldosterone), p < 0.05; $$, p < 0.01 in comparison with aldosterone alone.
FIGURE 7.
FIGURE 7.
Accommodation mode of finerenone within the MR ligand-binding pocket. A, schematic representation of the contacts between finerenone and the residues lining the binding pocket of MR. The hydrogen bonds and van der Waals contacts are depicted as solid red arrows and black dashed lines, respectively. The numbers of the secondary structure elements are indicated in colored circles or ovals. The residue numbers are indicated in boxes and colored according to the secondary structure element to which they belong. B, superimposition of finerenone and spironolactone within the MR-binding pocket. Only residues that anchor the ligands are shown. Hydrogen bonds between finerenone or spironolactone, and the polar residues are depicted as dashed red lines. In the MR-spironolactone model, the protein is colored in light blue with its side chains atoms in light blue, blue, and red for the carbon, nitrogen, and oxygen atoms, respectively. Spironolactone atoms are colored in pink, red, and yellow for the carbon, oxygen, and sulfur atoms, respectively. In the MR-finerenone model, the protein is in white with its side chains atoms in white, blue, and red for the carbon, nitrogen, and oxygen atoms, respectively. Finerenone atoms are in gold, blue, and red for the carbon, nitrogen, and oxygen atoms, respectively. This figure was produced using DINO.
FIGURE 8.
FIGURE 8.
Transactivation properties of MRA773G and MRS810M in response to finerenone. HEK 293T cells transiently expressing MRA773G or MRS810M were incubated for 16 h with 10−9 m aldosterone in the presence of increasing concentrations of finerenone. The activity of MRA773G or MRS810M to transactivate the luciferase gene, which is under the control of a GRE-containing promoter, was determined by measuring the luciferase activity, which was then normalized to the β-galactosidase activity and to the value obtained with 10−9 m aldosterone alone. The values are means ± S.E. of at least three independent experiments performed in triplicate. GraphPad Prism software was used to fit the curves and to calculate the IC50 values. Statistical significance was calculated with the Mann-Whitney nonparametric U tests with unpaired data and two-tailed calculations. * (MRS810M versus MRWT) and # (MRA773G versus MRWT), p < 0.05.

References

    1. Viengchareun S., Le Menuet D., Martinerie L., Munier M., Pascual-Le Tallec L., Lombès M. (2007) The mineralocorticoid receptor: insights into its molecular and (patho)physiological biology. Nucl. Recept. Signal. 5, e012. - PMC - PubMed
    1. Funder J. W. (2010) Aldosterone and mineralocorticoid receptors: past, present, and future. Endocrinology 151, 5098–5102 - PubMed
    1. Tomaschitz A., Pilz S., Ritz E., Obermayer-Pietsch B., Pieber T. R. (2010) Aldosterone and arterial hypertension. Nat. Rev. Endocrinol. 6, 83–93 - PubMed
    1. Rossi G. P., Bernini G., Desideri G., Fabris B., Ferri C., Giacchetti G., Letizia C., Maccario M., Mannelli M., Matterello M.-J., Montemurro D., Palumbo G., Rizzoni D., Rossi E., Pessina A. C., Mantero F., and PAPY Study Participants (2006) Renal damage in primary aldosteronism: results of the PAPY Study. Hypertension 48, 232–238 - PubMed
    1. Epstein M. (2006) Aldosterone blockade: an emerging strategy for abrogating progressive renal disease. Am. J. Med. 119, 912–919 - PubMed

Publication types

MeSH terms

Associated data

LinkOut - more resources