

Optical Coherence Tomography Angiography of the Peripapillary Retina in Glaucoma
- PMID: 26203793
- PMCID: PMC4950955
- DOI: 10.1001/jamaophthalmol.2015.2225
Optical Coherence Tomography Angiography of the Peripapillary Retina in Glaucoma
Abstract
Importance: Vascular factors may have important roles in the pathophysiology of glaucoma. A practical method for the clinical evaluation of ocular perfusion is needed to improve glaucoma management.
Objective: To detect peripapillary retinal perfusion in glaucomatous eyes compared with normal eyes using optical coherence tomography (OCT) angiography.
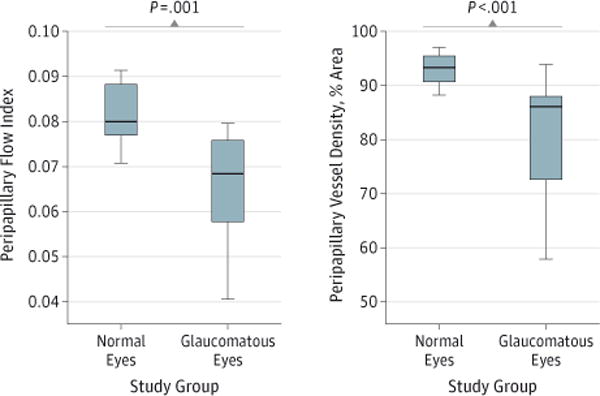
Design, setting, and participants: Prospective observational study performed from July 24, 2013, to April 17, 2014. Participants were recruited and tested at Casey Eye Institute, Oregon Health & Science University. In total, 12 glaucomatous eyes and 12 age-matched normal eyes were analyzed. The optic disc region was imaged twice using a 3 × 3-mm scan by a 70-kHz, 840-nm-wavelength spectral OCT system. The split-spectrum amplitude-decorrelation angiography algorithm was used. Peripapillary flow index was calculated as the mean decorrelation value in the peripapillary region, defined as a 700-µm-wide elliptical annulus around the disc. Peripapillary vessel density was the percentage area occupied by vessels. The data statistical analysis was performed from October 30, 2013, to May 30, 2014.
Main outcomes and measures: Variability was assessed by the coefficient of variation. The Mann-Whitney test was used to compare the 2 groups of eyes. Correlations between vascular and visual field variables were assessed by linear regression analysis.
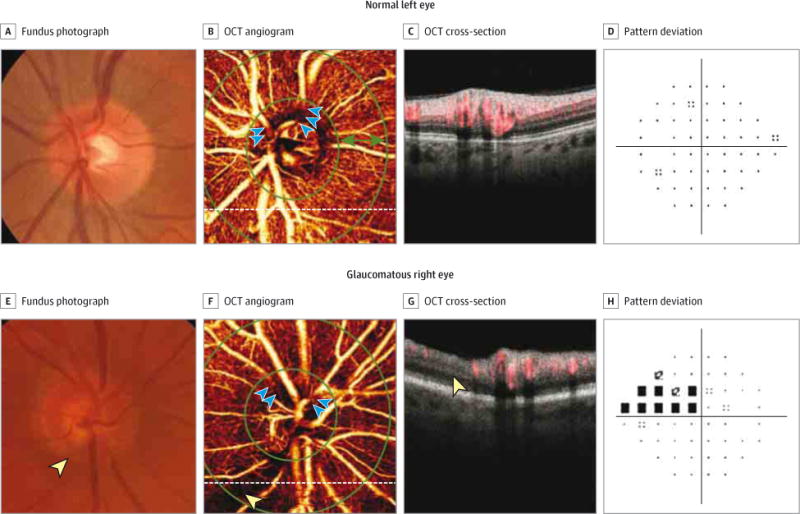
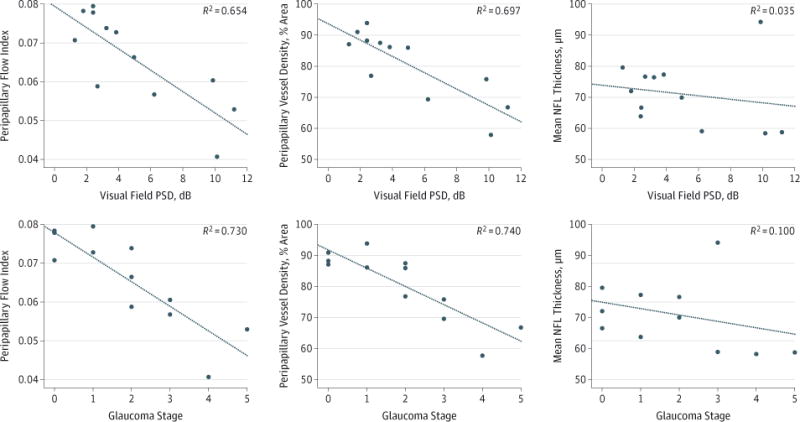
Results: In 12 normal eyes, a dense microvascular network around the disc was visible on OCT angiography. In 12 glaucomatous eyes, this network was visibly attenuated globally and focally. In normal eyes, between-visit reproducibilities of peripapillary flow index and peripapillary vessel density were 4.3% and 2.7% of the coefficient of variation, respectively, while the population variabilities of peripapillary flow index and peripapillary vessel density were 8.2% and 3.0% of the coefficient of variation, respectively. Peripapillary flow index and peripapillary vessel density in glaucomatous eyes were lower than those in normal eyes (P < .001 for both). Peripapillary flow index (Pearson r = -0.808) and peripapillary vessel density (Pearson r = -0.835) were highly correlated with visual field pattern standard deviation in glaucomatous eyes (P = .001 for both). The areas under the receiver operating characteristic curve for normal vs glaucomatous eyes were 0.892 for peripapillary flow index and 0.938 for peripapillary vessel density.
Conclusions and relevance: Using OCT angiography, reduced peripapillary retinal perfusion in glaucomatous eyes can be visualized as focal defects and quantified as peripapillary flow index and peripapillary vessel density, with high repeatability and reproducibility. Quantitative OCT angiography may have value in future studies to determine its potential usefulness in glaucoma evaluation.
Conflict of interest statement
Figures
Comment in
-
Measuring Blood Flow: So What?JAMA Ophthalmol. 2015 Sep;133(9):1052-3. doi: 10.1001/jamaophthalmol.2015.2287. JAMA Ophthalmol. 2015. PMID: 26203625 Free PMC article. No abstract available.
References
-
- Leske MC. Open-angle glaucoma: an epidemiologic overview. Ophthalmic Epidemiol. 2007;14(4):166–172. - PubMed
-
- Congdon NG, Friedman DS, Lietman T. Important causes of visual impairment in the world today. JAMA. 2003;290(15):2057–2060. - PubMed
-
- Gillespie BW, Musch DC, Guire KE, et al. CIGTS (Collaborative Initial Glaucoma Treatment Study) Study Group The Collaborative Initial Glaucoma Treatment Study: baseline visual field and test-retest variability. Invest Ophthalmol Vis Sci. 2003;44(6):2613–2620. - PubMed
-
- Tanna AP, Bandi JR, Budenz DL, et al. Interobserver agreement and intraobserver reproducibility of the subjective determination of glaucomatous visual field progression. Ophthalmology. 2011;118(1):60–65. - PubMed
Publication types
MeSH terms
Grants and funding
LinkOut - more resources
Full Text Sources
Other Literature Sources
Miscellaneous
