. 2015 Jul 23;10(7):e0133691.
doi: 10.1371/journal.pone.0133691. eCollection 2015.

A Novel Quality Measure and Correction Procedure for the Annotation of Microbial Translation Initiation Sites

Affiliations

A Novel Quality Measure and Correction Procedure for the Annotation of Microbial Translation Initiation Sites

Lex Overmars et al. PLoS One. .

Abstract

The identification of translation initiation sites (TISs) constitutes an important aspect of sequence-based genome analysis. An erroneous TIS annotation can impair the identification of regulatory elements and N-terminal signal peptides, and also may flaw the determination of descent, for any particular gene. We have formulated a reference-free method to score the TIS annotation quality. The method is based on a comparison of the observed and expected distribution of all TISs in a particular genome given prior gene-calling. We have assessed the TIS annotations for all available NCBI RefSeq microbial genomes and found that approximately 87% is of appropriate quality, whereas 13% needs substantial improvement. We have analyzed a number of factors that could affect TIS annotation quality such as GC-content, taxonomy, the fraction of genes with a Shine-Dalgarno sequence and the year of publication. The analysis showed that only the first factor has a clear effect. We have then formulated a straightforward Principle Component Analysis-based TIS identification strategy to self-organize and score potential TISs. The strategy is independent of reference data and a priori calculations. A representative set of 277 genomes was subjected to the analysis and we found a clear increase in TIS annotation quality for the genomes with a low quality score. The PCA-based annotation was also compared with annotation with the current tool of reference, Prodigal. The comparison for the model genome of Escherichia coli K12 showed that both methods supplement each other and that prediction agreement can be used as an indicator of a correct TIS annotation. Importantly, the data suggest that the addition of a PCA-based strategy to a Prodigal prediction can be used to 'flag' TIS annotations for re-evaluation and in addition can be used to evaluate a given annotation in case a Prodigal annotation is lacking.


Conflict of interest statement

Competing Interests: The authors have declared that no competing interests exist.

Figures

Fig 1
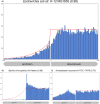
Fig 1. Three typical distributions of alternative start codons found for genomes in the NCBI RefSeq database.
(A) The distribution of alternative starts in Escherichia coli K12 MG1655; (B) Bacillus thuringiensis str. Al Hakam; and (C) Acinetobacter baumannii ATCC 17978. For all ORFs that included an annotated gene and TIS, the total number of alternative start codons for each codon position relative to the annotated translation start were counted. The green line represents the expected distribution as determined using formula 1 In genomes that adhere to Fig 1A the observed and expected distribution are alike, whereas for genomes that adhere to B or C the observed distribution of alternative start codons given the annotation is clearly deviating from the expected distribution (green line). A comparison of the observed and expected distribution provides an inherent quality measure for genome-wide gene-prediction accuracy.
Fig 2
Fig 2. Correlation coefficients between observed alternative start frequencies and expected alternative start frequencies for microbial genomes.
(A) Spearman’s rho coefficients for all bacterial RefSeq genomes with > 500 ORFs. (B) Spearman’s rho coefficients for all Archaeal RefSeq genomes with > 500 ORFs.
Fig 3
Fig 3. Effects of year of sequencing, GC-content and taxonomy on TIS-prediction accuracy.
The boxplots show the distribution of the calculated correlation values (between the observed and expected distribution of alternative TISs) (Y axis) for: (A) all bacterial and archaeal RefSeq genomes grouped by year of sequencing (NCBI Bioproject data; [38]); (B) The RefSeq genomes grouped into 6 bins according to their GC%; (C) The RefSeq genomes grouped according to phylum; and (D) 277 selected bacterial and archaeal genomes with varying SD-index (proportion of Shine-Dalgarno sequence-preceded genes) [4].
Fig 4
Fig 4. (A) The relative position of PCA-based TIS annotations that deviate from the RefSeq annotation for E. coli MG1655.
(B) The effect of sequence vector length on the number of matching PCA-based and RefSeq TIS annotations in E. coli K12 MG1655 and B. subtilis 168. The following vector lengths were compared (denoted as: length upstream in nt. and length downstream in nt.): i) 60 & 60, ii) 36 & 36, iii) 30 & 24, iv) 30 & 18, v) 24 & 30, vi) 24 & 24, vii) 24 & 18, viii) 18 & 30 ix) 18 & 24 and x) 18 & 18.
Fig 5
Fig 5. A comparison of TIS prediction accuracy between RefSeq, PCA-based and Prodigal annotation.
Scatterplot of the correlation between observed alternative start codon frequencies and expected alternative start codon frequencies (i.e., the TIS annotation quality measure) for both the original TIS annotation as found in the RefSeq database (Y axis) and the adjusted annotations (X axis) based on (A) our iterative PCA pipeline and (B) Prodigal. (C) Scatterplot for PCA-based annotation versus Prodigal. The color scale represents the GC% of the corresponding genome (blue: high, green: average, red: low)

References

    1. Shine J, Dalgarno L (1974) The 3'-terminal sequence of Escherichia coli 16S ribosomal RNA: complementarity to nonsense triplets and ribosome binding sites. Proc Natl Acad Sci U S A 71: 1342–1346. - PMC - PubMed
    1. Ma J, Campbell A, Karlin S (2002) Correlations between Shine-Dalgarno sequences and gene features such as predicted expression levels and operon structures. J Bacteriol 184: 5733–5745. - PMC - PubMed
    1. Skorski P, Leroy P, Fayet O, Dreyfus M, Hermann-Le Denmat S (2006) The highly efficient translation initiation region from the Escherichia coli rpsA gene lacks a shine-dalgarno element. J Bacteriol 188: 6277–6285. - PMC - PubMed
    1. Nakagawa S, Niimura Y, Miura K, Gojobori T (2010) Dynamic evolution of translation initiation mechanisms in prokaryotes. Proc Natl Acad Sci U S A 107: 6382–6387. 10.1073/pnas.1002036107 - DOI - PMC - PubMed
    1. Komarova AV, Tchufistova LS, Dreyfus M, Boni IV (2005) AU-rich sequences within 5' untranslated leaders enhance translation and stabilize mRNA in Escherichia coli . J Bacteriol 187: 1344–1349. - PMC - PubMed

Publication types

MeSH terms

LinkOut - more resources