. 2015 Jul 23;11(7):e1004284.
doi: 10.1371/journal.pcbi.1004284. eCollection 2015 Jul.

Fast Simulation of Mechanical Heterogeneity in the Electrically Asynchronous Heart Using the MultiPatch Module

Affiliations

Fast Simulation of Mechanical Heterogeneity in the Electrically Asynchronous Heart Using the MultiPatch Module

John Walmsley et al. PLoS Comput Biol. .

Abstract

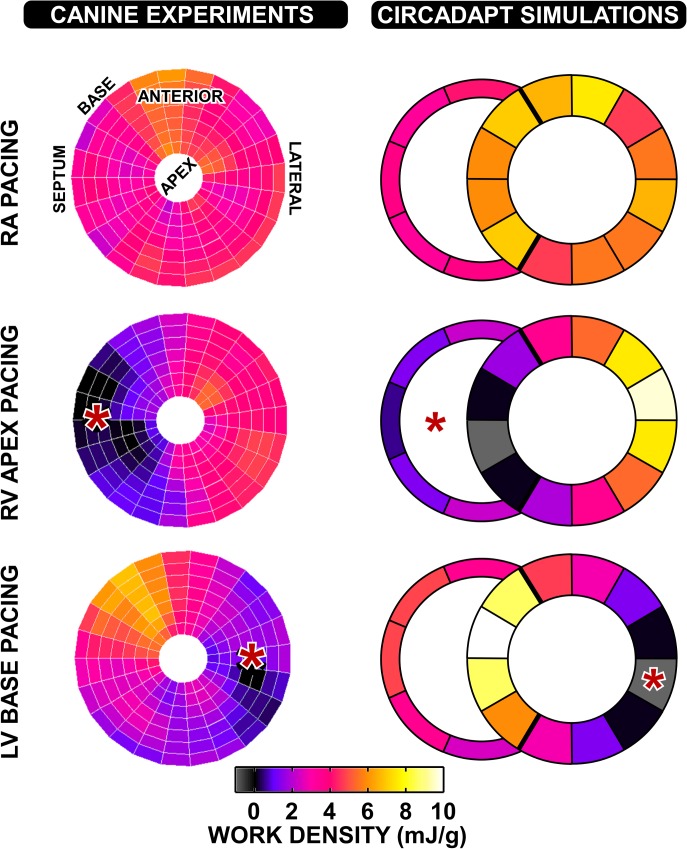
Cardiac electrical asynchrony occurs as a result of cardiac pacing or conduction disorders such as left bundle-branch block (LBBB). Electrically asynchronous activation causes myocardial contraction heterogeneity that can be detrimental for cardiac function. Computational models provide a tool for understanding pathological consequences of dyssynchronous contraction. Simulations of mechanical dyssynchrony within the heart are typically performed using the finite element method, whose computational intensity may present an obstacle to clinical deployment of patient-specific models. We present an alternative based on the CircAdapt lumped-parameter model of the heart and circulatory system, called the MultiPatch module. Cardiac walls are subdivided into an arbitrary number of patches of homogeneous tissue. Tissue properties and activation time can differ between patches. All patches within a wall share a common wall tension and curvature. Consequently, spatial location within the wall is not required to calculate deformation in a patch. We test the hypothesis that activation time is more important than tissue location for determining mechanical deformation in asynchronous hearts. We perform simulations representing an experimental study of myocardial deformation induced by ventricular pacing, and a patient with LBBB and heart failure using endocardial recordings of electrical activation, wall volumes, and end-diastolic volumes. Direct comparison between simulated and experimental strain patterns shows both qualitative and quantitative agreement between model fibre strain and experimental circumferential strain in terms of shortening and rebound stretch during ejection. Local myofibre strain in the patient simulation shows qualitative agreement with circumferential strain patterns observed in the patient using tagged MRI. We conclude that the MultiPatch module produces realistic regional deformation patterns in the asynchronous heart and that activation time is more important than tissue location within a wall for determining myocardial deformation. The CircAdapt model is therefore capable of fast and realistic simulations of dyssynchronous myocardial deformation embedded within the closed-loop cardiovascular system.


Conflict of interest statement

The authors have declared that, beyond the funding listed above, no relevant competing interests exist.

Figures

Fig 1
Fig 1. Simulation protocol.
Panel A shows a schematic representation of the CircAdapt model, adapted from Lumens et al (2009) [25]. The TriSeg module representing mechanical interaction between the left and right ventricles, the chamber module representing the left and right atria, the cardiac valves, major vessels, and systemic and pulmonary resistances are shown. Panel B shows activation patterns used for the simulation of RA pacing, RV apex pacing, and LV base pacing, together with the atrio-ventricular (AV) delay. The activation map for the patient specific simulation of LBBB is shown, together with the endocardial mapping data recorded from the endocardium plotted on a standard AHA segmentation without the apical segment in panel C. The colour bar denotes time of activation in ms, and is common to all activation maps. The asterisk (*) indicates the approximate location of pacing in the model for reference.
Fig 2
Fig 2. Quantitative comparison of strain patterns in canine hearts to simulations.
The top panel shows experimental strain patterns during right atrial (RA), right ventricular (RV) apex, and left ventricular (LV) base pacing. The experimental strain data were originally published by Prinzen et al. (1999) [4]. The middle panel shows the corresponding CircAdapt simulations. Arrows indicate the order of activation throughout the ventricles in the RV apex and LV base simulations. Note the correspondence of the simulated patterns with the experiments, shown in black. The remainder of the simulated strain is plotted in grey. In both plots, asterisks (*) denote the approximate location of the pacing electrode, and the aortic ejection period is indicated by vertical dashed lines and a shaded area. In each panel, shortening during ejection (ESh) is shown in blue, and the rebound stretch after initial contraction (RSt) is shown in red. Experimental RSt and ESh were calculated during this study. The bottom panel plots simulated ESh (blue) and RSt (red) against values derived from the experimental data for each patch. The experimental data is on the left, and the simulated data is the right hand bar.
Fig 3
Fig 3. Comparison of stress-strain loops in canine hearts with simulations.
The top panel shows experimental myofibre stress—length loops during RA, RV apex, and LV base pacing. The experimental data were originally published by Prinzen et al. (1999) [4].The bottom panel shows the corresponding CircAdapt simulations. Arrows indicate the order of activation throughout the ventricles in the RV apex and LV base simulations. Note the correspondence of the simulated patterns with the experiments, shown in black. The remainder of the simulated stress-strain loop is plotted in grey.
Fig 4
Fig 4. Redistribution of work in the canine heart during pacing.
The left-hand panels show work density distributions within the LV during RA, RV apex, and LV base pacing (data originally published by Prinzen et al. 1999 [4]). Work density is plotted in mJ/g. Darker regions indicate lower work density, and lighter regions indicate higher work density. The right hand panel shows the corresponding distribution of work density from the CircAdapt simulations. The scales on the left and right hand columns are different between the two figures. The asterisks (*) denote the location of the pacing electrode.
Fig 5
Fig 5. Comparison of patient tagged MRI strain with simulated deformation.
Tagged-MRI strain patterns from the patient with LBBB are shown in the left hand panel, with the corresponding CircAdapt simulated strain patterns shown in the right panel. Strain patterns from the five septal segments are shown as dashed lines, and strain patterns from the LV free wall segments are shown as solid lines. Strain patterns are coloured according to their mean time of activation. The endocardial mapping activation map and the activation pattern used in the simulation are shown in the inset. The black lines denote the mean strain values from the septal and LV free wall segments. Dashed vertical lines denote pulmonary valve opening (PO) and closing (PC). Solid vertical lines denote aortic valve opening (AO) and closing (AC).
Fig 6
Fig 6. Concepts behind the MultiPatch model.
Panel A represents one of the patches making up a wall, with its area Ap,j being defined on the mid-wall surface. The mid-wall tension Tw acts on this surface. The patch is also assigned a volume Vp,j. Panel B demonstrates the difference between the patch areas Ap,j, Ap0,j, and ApRef,j in terms of sarcomere behaviour.
Fig 7
Fig 7. The sequence of calculations using the MultiPatch model.
Calculations are divided into three levels–cavity, wall, and patch. Calculated quantities are given in black text. The names of the variables used in the text are shown in red. Black arrows show the sequence in which calculations are performed. White numbers indicate the equation number in the text used for calculation.

References

    1. Durrer D, van Dam RT, Freud GE, Janse MJ, Meijler FL, et al. (1970) Total excitation of the isolated human heart. Circulation 41: 899–912. - PubMed
    1. Strauss DG, Selvester RH, Wagner GS (2011) Defining left bundle branch block in the era of cardiac resynchronization therapy. Am J Cardiol 107: 927–934. 10.1016/j.amjcard.2010.11.010 - DOI - PubMed
    1. Dillon JC, Chang S, Feigenbaum H (1974) Echocardiographic manifestations of left-bundle branch-block. Circulation 49: 876–880. - PubMed
    1. Prinzen FW, Hunter WC, Wyman BT, McVeigh ER (1999) Mapping of regional myocardial strain and work during ventricular pacing: experimental study using magnetic resonance imaging tagging. J Am Coll Cardiol 33: 1735–1742. - PMC - PubMed
    1. Han Y, Chan J, Haber I, Peters DC, Zimetbaum PJ, et al. (2011) Circumferential myocardial strain in cardiomyopathy with and without left bundle branch block. J Cardiov Magn Reson 12: 2. - PMC - PubMed

Publication types