

Genome-Wide Mapping of Collier In Vivo Binding Sites Highlights Its Hierarchical Position in Different Transcription Regulatory Networks
- PMID: 26204530
- PMCID: PMC4512700
- DOI: 10.1371/journal.pone.0133387
Genome-Wide Mapping of Collier In Vivo Binding Sites Highlights Its Hierarchical Position in Different Transcription Regulatory Networks
Abstract
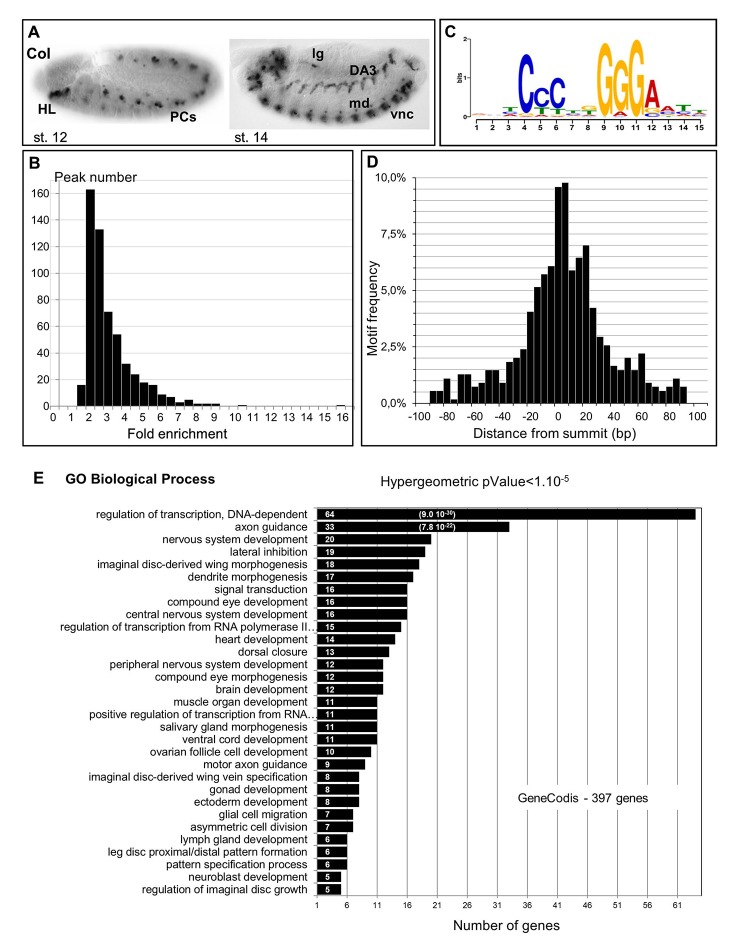
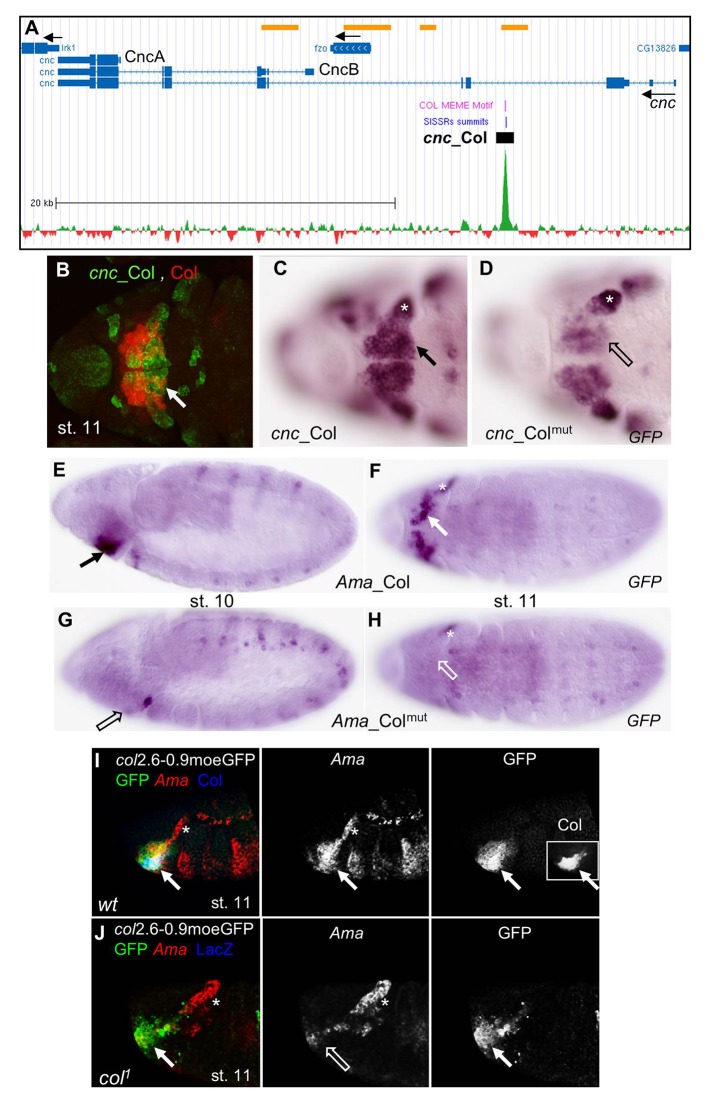
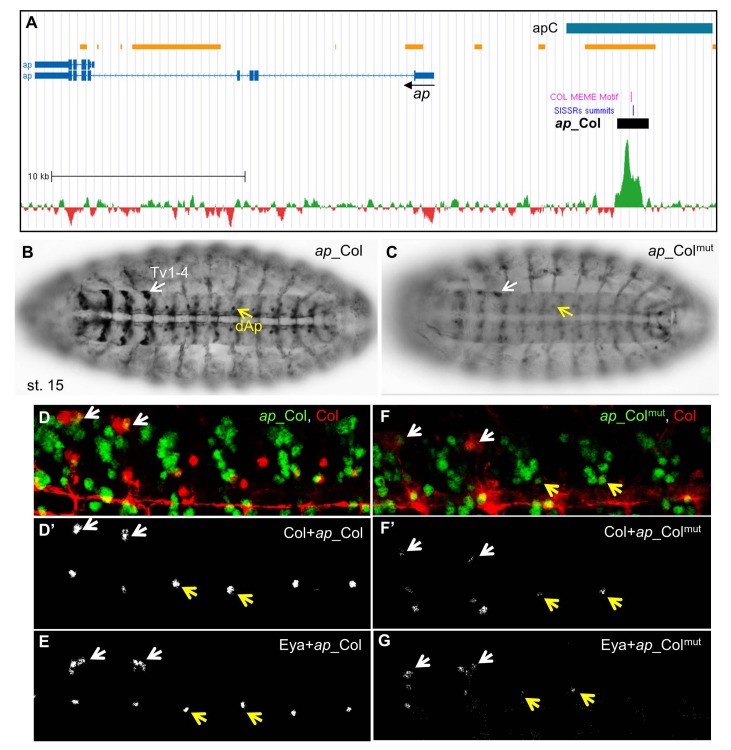
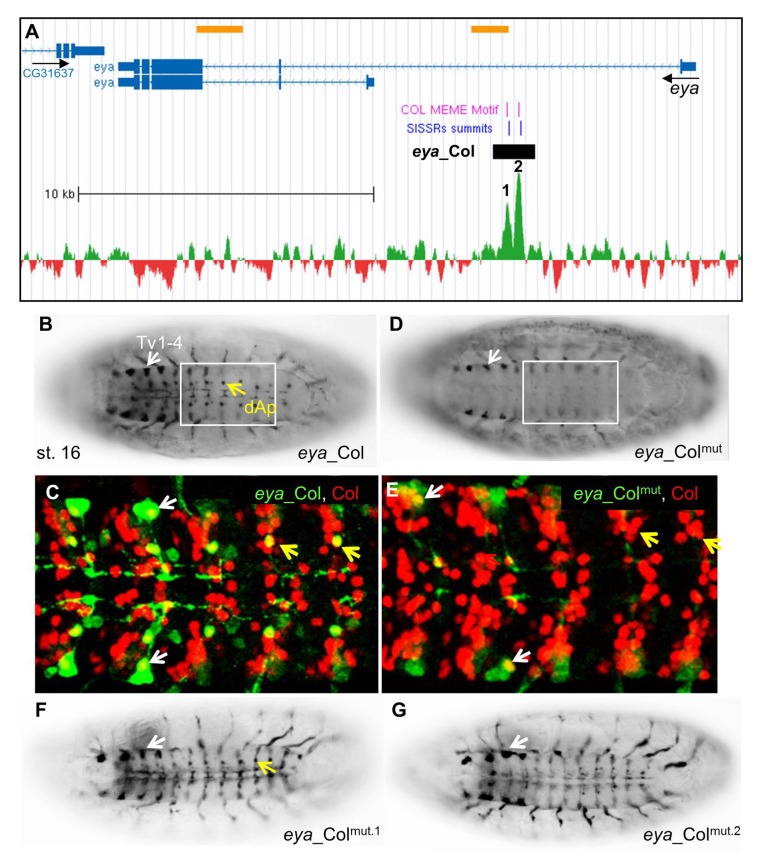
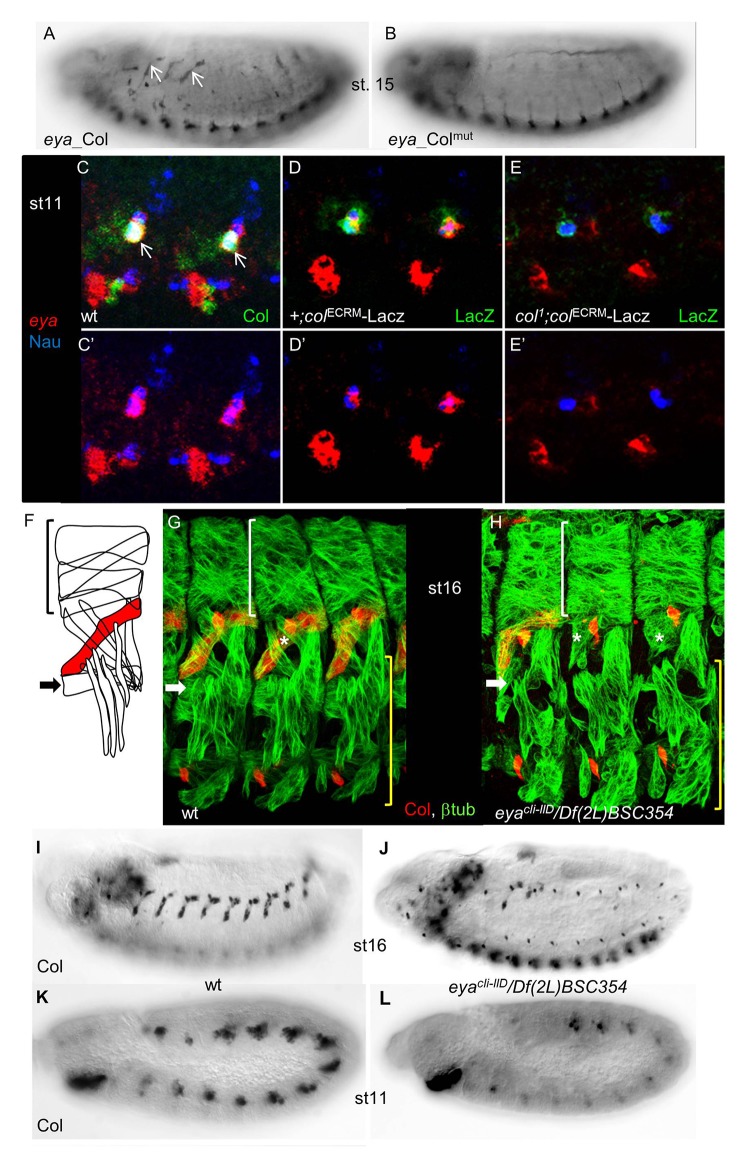
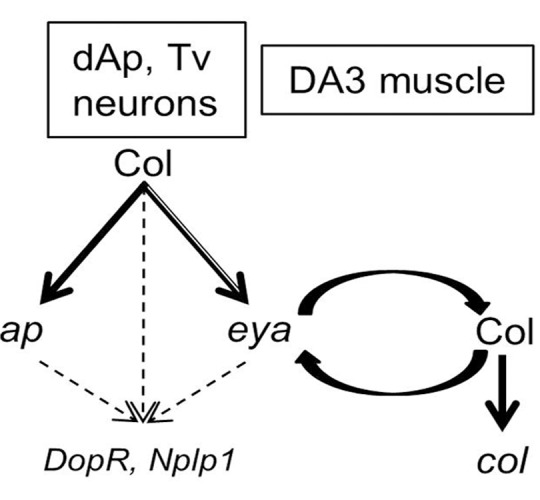
Collier, the single Drosophila COE (Collier/EBF/Olf-1) transcription factor, is required in several developmental processes, including head patterning and specification of muscle and neuron identity during embryogenesis. To identify direct Collier (Col) targets in different cell types, we used ChIP-seq to map Col binding sites throughout the genome, at mid-embryogenesis. In vivo Col binding peaks were associated to 415 potential direct target genes. Gene Ontology analysis revealed a strong enrichment in proteins with DNA binding and/or transcription-regulatory properties. Characterization of a selection of candidates, using transgenic CRM-reporter assays, identified direct Col targets in dorso-lateral somatic muscles and specific neuron types in the central nervous system. These data brought new evidence that Col direct control of the expression of the transcription regulators apterous and eyes-absent (eya) is critical to specifying neuronal identities. They also showed that cross-regulation between col and eya in muscle progenitor cells is required for specification of muscle identity, revealing a new parallel between the myogenic regulatory networks operating in Drosophila and vertebrates. Col regulation of eya, both in specific muscle and neuronal lineages, may illustrate one mechanism behind the evolutionary diversification of Col biological roles.
Conflict of interest statement
Figures
Similar articles
-
Collier transcription in a single Drosophila muscle lineage: the combinatorial control of muscle identity.Development. 2007 Dec;134(24):4347-55. doi: 10.1242/dev.008409. Epub 2007 Nov 14. Development. 2007. PMID: 18003742
-
Combinatorial coding of Drosophila muscle shape by Collier and Nautilus.Dev Biol. 2012 Mar 1;363(1):27-39. doi: 10.1016/j.ydbio.2011.12.018. Epub 2011 Dec 20. Dev Biol. 2012. PMID: 22200594
-
Requirement for the Drosophila COE transcription factor Collier in formation of an embryonic muscle: transcriptional response to notch signalling.Development. 1999 Apr;126(7):1495-504. doi: 10.1242/dev.126.7.1495. Development. 1999. PMID: 10068642
-
Diversification of muscle types in Drosophila embryos.Exp Cell Res. 2022 Jan 1;410(1):112950. doi: 10.1016/j.yexcr.2021.112950. Epub 2021 Nov 26. Exp Cell Res. 2022. PMID: 34838813 Review.
-
Stepwise Progression of Embryonic Patterning.Trends Genet. 2016 Jul;32(7):432-443. doi: 10.1016/j.tig.2016.04.004. Epub 2016 May 24. Trends Genet. 2016. PMID: 27230753 Free PMC article. Review.
Cited by
-
Intrinsic control of muscle attachment sites matching.Elife. 2020 Jul 24;9:e57547. doi: 10.7554/eLife.57547. Elife. 2020. PMID: 32706334 Free PMC article.
-
Genetic dissection of the Transcription Factor code controlling serial specification of muscle identities in Drosophila.Elife. 2016 Jul 20;5:e14979. doi: 10.7554/eLife.14979. Elife. 2016. PMID: 27438571 Free PMC article.
-
Dynamics of transcriptional (re)-programming of syncytial nuclei in developing muscles.BMC Biol. 2017 Jun 9;15(1):48. doi: 10.1186/s12915-017-0386-2. BMC Biol. 2017. PMID: 28599653 Free PMC article.
-
Neuronal cell fate specification by the molecular convergence of different spatio-temporal cues on a common initiator terminal selector gene.PLoS Genet. 2017 Apr 17;13(4):e1006729. doi: 10.1371/journal.pgen.1006729. eCollection 2017 Apr. PLoS Genet. 2017. PMID: 28414802 Free PMC article.
-
MyoD reprogramming requires Six1 and Six4 homeoproteins: genome-wide cis-regulatory module analysis.Nucleic Acids Res. 2016 Oct 14;44(18):8621-8640. doi: 10.1093/nar/gkw512. Epub 2016 Jun 14. Nucleic Acids Res. 2016. PMID: 27302134 Free PMC article.
References
-
- Levine M, Tjian R (2003) Transcription regulation and animal diversity. Nature 424: 147–151. - PubMed
-
- Hagman J, Belanger C, Travis A, Turck CW, Grosschedl R (1993) Cloning and functional characterization of early B-cell factor, a regulator of lymphocyte-specific gene expression. Genes Dev 7: 760–773. - PubMed
-
- Wang MM, Reed RR (1993) Molecular cloning of the olfactory neuronal transcription factor Olf-1 by genetic selection in yeast. Nature 364: 121–126. - PubMed
-
- Crozatier M, Valle D, Dubois L, Ibnsouda S, Vincent A (1996) Collier, a novel regulator of Drosophila head development, is expressed in a single mitotic domain. Curr Biol 6: 707–718. - PubMed
Publication types
MeSH terms
Substances
Associated data
- Actions
LinkOut - more resources
Full Text Sources
Other Literature Sources
Molecular Biology Databases
Research Materials
