

Diagnostic imaging of cervical intraepithelial neoplasia based on hematoxylin and eosin fluorescence
- PMID: 26204927
- PMCID: PMC4513699
- DOI: 10.1186/s13000-015-0343-8
Diagnostic imaging of cervical intraepithelial neoplasia based on hematoxylin and eosin fluorescence
Abstract
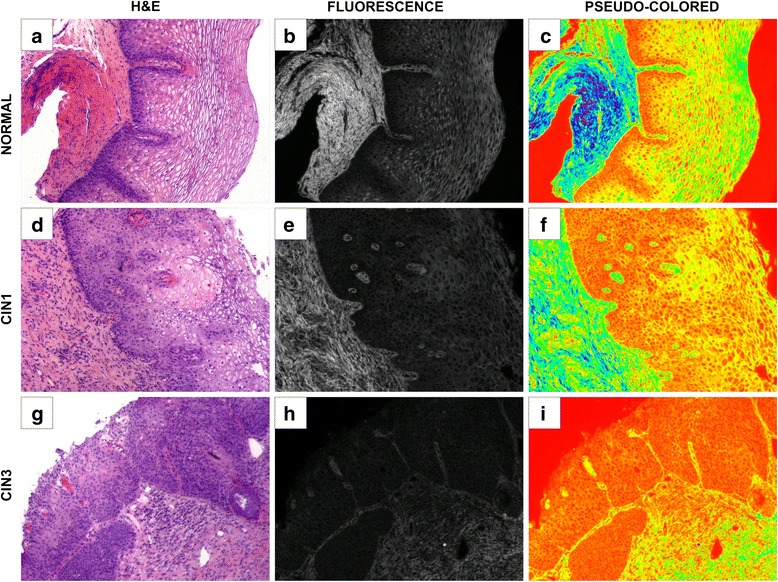
Background: Pathological classification of cervical intraepithelial neoplasia (CIN) is problematic as it relies on subjective criteria. We developed an imaging method that uses spectroscopy to assess the fluorescent intensity of cervical biopsies derived directly from hematoxylin and eosin (H&E) stained tissues.
Methods: Archived H&E slides were identified containing normal cervical tissue, CIN I, and CIN III cases, from a Community Hospital and an Academic Medical Center. Cases were obtained by consensus review of at least 2 senior pathologists. Images from H&E slides were captured first with bright field illumination and then with fluorescent illumination. We used a Zeiss Axio Observer Z1 microscope and an AxioVision 4.6.3-AP1 camera at excitation wavelength of 450-490 nm with emission captured at 515-565 nm. The 32-bit grayscale fluorescence images were used for image analysis.
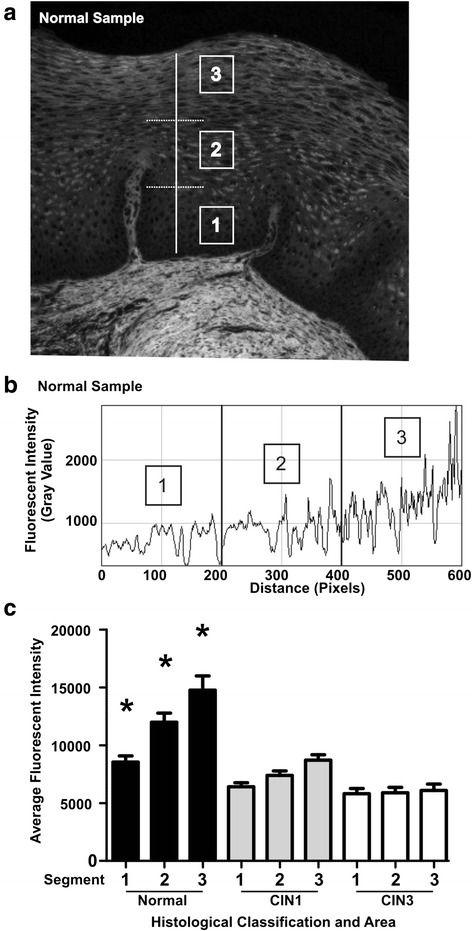
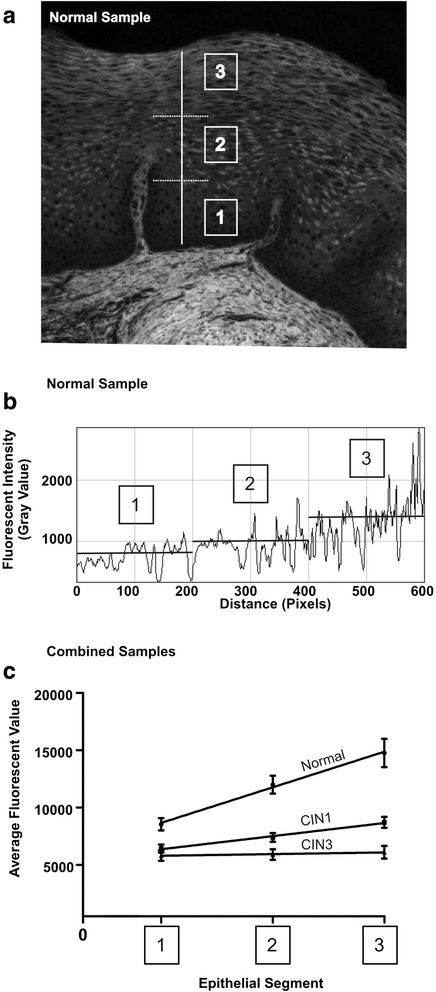
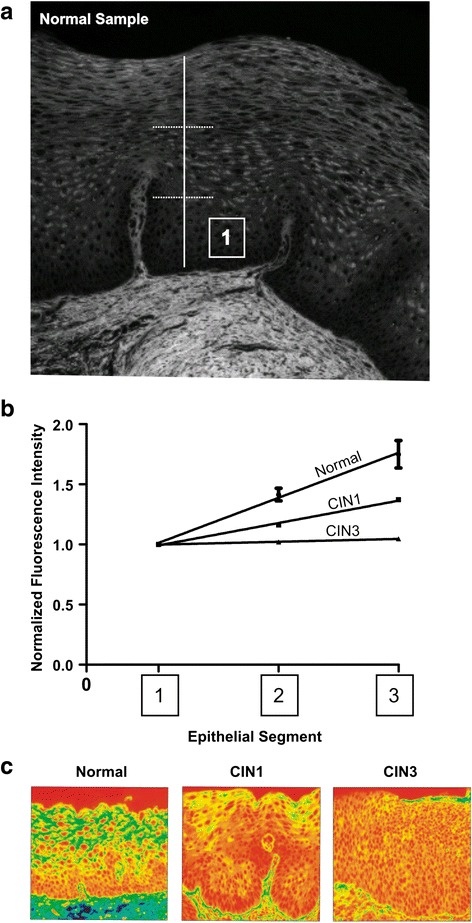
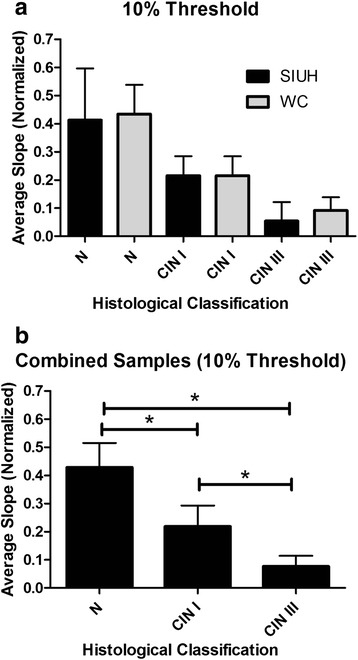
Results: We reviewed 108 slides: 46 normal, 33 CIN I and 29 CIN III. Fluorescent intensity increased progressively in normal epithelial tissue as cells matured and advanced from the basal to superficial regions of the epithelium. In CIN I cases this change was less prominent as compared to normal. In high grade CIN lesions, there was a slight or no increase in fluorescent intensity. All groups examined were statistically different.
Conclusion: Presently, there are no markers to help in classification of CIN I-III lesions. Our imaging method may complement standard H&E pathological review and provide objective criteria to support the CIN diagnosis.
Figures
Similar articles
-
Utility of p16INK4a expression for the interpretation of uterine cervical biopsies in Kenya.Pan Afr Med J. 2021 Sep 22;40:55. doi: 10.11604/pamj.2021.40.55.21116. eCollection 2021. Pan Afr Med J. 2021. PMID: 34795834 Free PMC article.
-
Fluorescence microscopy of H&E stained cervical biopsies to assist the diagnosis and grading of CIN.Pathol Res Pract. 2018 May;214(5):605-611. doi: 10.1016/j.prp.2018.03.021. Epub 2018 Mar 26. Pathol Res Pract. 2018. PMID: 29627221 Review.
-
Immunostaining for p16INK4a used as a conjunctive tool improves interobserver agreement of the histologic diagnosis of cervical intraepithelial neoplasia.Am J Surg Pathol. 2008 Apr;32(4):502-12. doi: 10.1097/PAS.0b013e31815ac420. Am J Surg Pathol. 2008. PMID: 18223479
-
Multifeature Quantification of Nuclear Properties from Images of H&E-Stained Biopsy Material for Investigating Changes in Nuclear Structure with Advancing CIN Grade.J Healthc Eng. 2018 Jul 5;2018:6358189. doi: 10.1155/2018/6358189. eCollection 2018. J Healthc Eng. 2018. PMID: 30073048 Free PMC article.
-
In vivo fluorescence spectroscopy: potential for non-invasive, automated diagnosis of cervical intraepithelial neoplasia and use as a surrogate endpoint biomarker.J Cell Biochem Suppl. 1994;19:111-9. J Cell Biochem Suppl. 1994. PMID: 7823582 Review.
Cited by
-
Optical techniques for cervical neoplasia detection.Beilstein J Nanotechnol. 2017 Sep 6;8:1844-1862. doi: 10.3762/bjnano.8.186. eCollection 2017. Beilstein J Nanotechnol. 2017. PMID: 29046833 Free PMC article. Review.
-
Embedding complementary imaging data in laser scanning microscopy micrographs by reversible watermarking.Biomed Opt Express. 2016 Mar 3;7(4):1127-37. doi: 10.1364/BOE.7.001127. eCollection 2016 Apr 1. Biomed Opt Express. 2016. PMID: 27446641 Free PMC article.
References
-
- Denny L. Cervical cancer: prevention and treatment. Discov Med. 2012;14(75):125–31. - PubMed
-
- Wright T, Ronnet B, Kurman R, Ferenczy A. Precancerous lesions of the cervix. 6th ed. Blastein's pathology of the female gental tract. Springer Verlag; 2011
-
- Parker MF, Zahn CM, Vogel KM, Olsen CH, Miyazawa K, O'Connor DM. Discrepancy in the interpretation of cervical histology by gynecologic pathologists. Obstet Gynecol. 2002;100(2):277–80. - PubMed
Publication types
MeSH terms
Substances
LinkOut - more resources
Full Text Sources
Other Literature Sources
Medical
