Review
. 2015 Jul 22;20(7):13384-421.
doi: 10.3390/molecules200713384.

Molecular docking and structure-based drug design strategies

Affiliations
Review

Molecular docking and structure-based drug design strategies

Leonardo G Ferreira et al. Molecules. .

Abstract

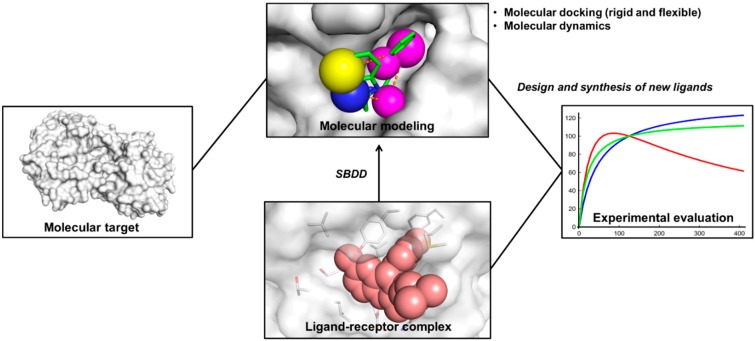
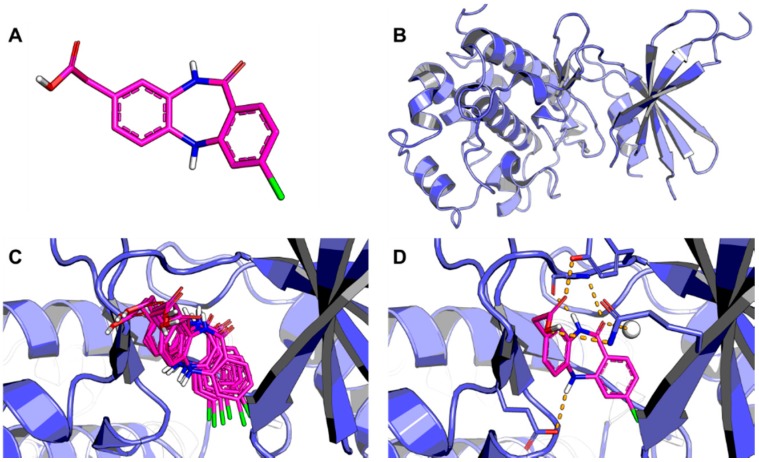
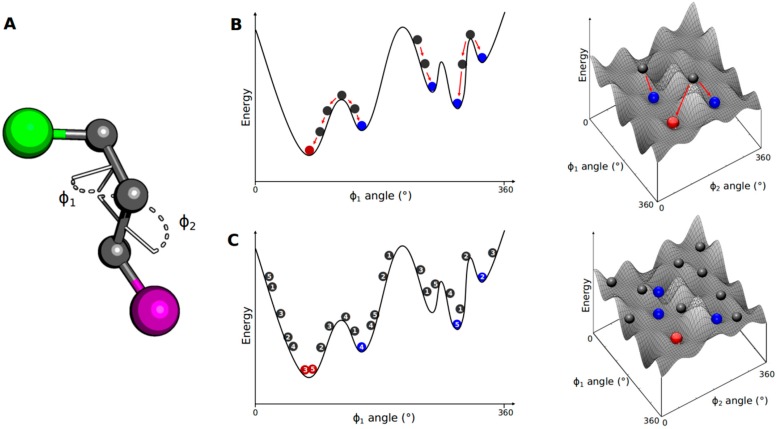
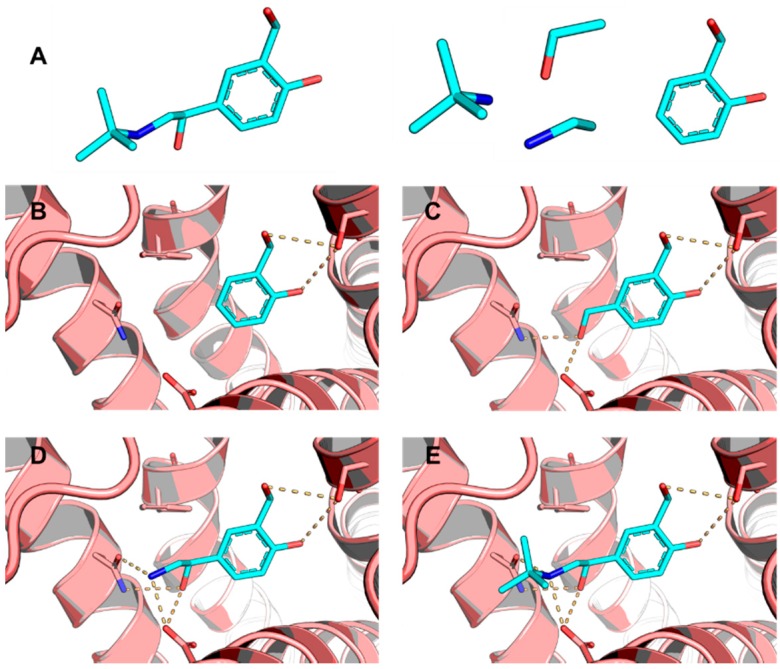
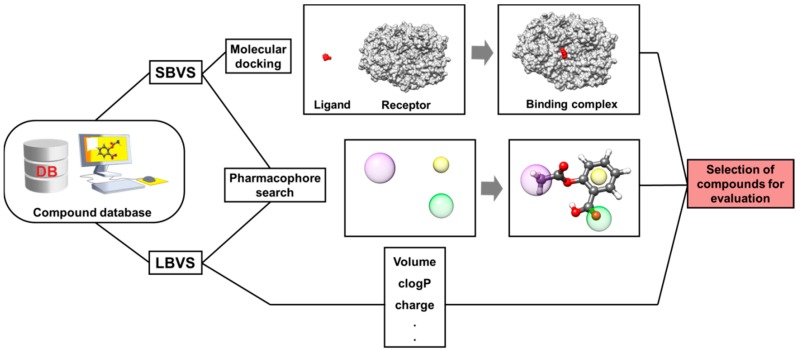
Pharmaceutical research has successfully incorporated a wealth of molecular modeling methods, within a variety of drug discovery programs, to study complex biological and chemical systems. The integration of computational and experimental strategies has been of great value in the identification and development of novel promising compounds. Broadly used in modern drug design, molecular docking methods explore the ligand conformations adopted within the binding sites of macromolecular targets. This approach also estimates the ligand-receptor binding free energy by evaluating critical phenomena involved in the intermolecular recognition process. Today, as a variety of docking algorithms are available, an understanding of the advantages and limitations of each method is of fundamental importance in the development of effective strategies and the generation of relevant results. The purpose of this review is to examine current molecular docking strategies used in drug discovery and medicinal chemistry, exploring the advances in the field and the role played by the integration of structure- and ligand-based methods.

Keywords: SBDD; SBVS; drug discovery; molecular interaction; molecular modeling; molecular target; pharmacophore; virtual screening.


Conflict of interest statement

The authors declare no conflict of interest.

Figures

Figure 1
Figure 1
Outline of SBDD. The three-dimensional structure of the molecular target is employed in molecular modeling studies. Promising compounds are synthesized and then experimentally evaluated. Given that bioactive small-molecules are discovered, the structure of a ligand-receptor complex can be obtained. The binding complex is used in molecular modeling studies and novel compounds are designed.
Figure 2
Figure 2
Outline of the molecular docking process. (A) Three-dimensional structure of the ligand; (B) Three-dimensional structure of the receptor; (C) The ligand is docked into the binding cavity of the receptor and the putative conformations are explored; (D) The most likely binding conformation and the corresponding intermolecular interactions are identified. The protein backbone is represented as a cartoon. The ligand (carbon in magenta) and active site residues (carbon in blue) are shown in stick representation. Water is shown as a white sphere and hydrogen bonds are indicated as dashed lines.
Figure 3
Figure 3
Small-molecule conformational search methods. (A) A molecule containing two bulky groups (green and purple spheres) has its conformation defined by two internal dihedrals Φ1 and Φ2; (B) Considering Φ2 as a frozen dihedral, the energy variation due to rotation of Φ1 is plotted in a 1D energy landscape. The initial structure (grey spheres) is modified by changing Φ1, leading to a decrease in energy. The systematic search algorithm changes all structural parameters until a local (blue spheres) or global (red sphere) energy minimum is reached; (C) The stochastic search explores the conformational space by randomly generating distinct conformations, populating a broad range of the energy landscape. This procedure increases the probability of finding a global energy minimum.
Figure 4
Figure 4
The incremental construction method. (A) The ligand (stick representation, carbon in cyan) is broken into several fragments; (B) The anchor fragment is docked in the binding site of the molecular target (cartoon representation, carbon in salmon); (C) The next fragment is docked after the anchor fragment; (D and E) The other fragments are docked sequentially to construct the entire ligand in its binding conformation. Residues in the active site are shown in stick representation (carbon in salmon). Hydrogen bonds are indicated as dashed lines.
Figure 5
Figure 5
The SBVS and LBVS approaches. Virtual compound databases can undergo different filtering procedures. In SBVS approaches, the three-dimensional structure of the molecular target is employed to identify compounds compatible with the properties of the target binding site. In pharmacophore modeling, compound collections are employed to generate structural patterns that should be present in active compounds. In LBVS studies, molecular descriptors known to be relevant for biological activity are used as selection criteria to identify suitable compounds for experimental evaluation.
Figure 6
Figure 6
(A) Structure of the tuberculostatic drug isoniazid; (B) The isonicotinic-acyl moiety covalently bound to NADH in the binding site of InhA (PDB 1ZID, 2.70 Å). The protein backbone is represented as a cartoon. The isonicotinic-acyl fragment (carbon in yellow) and NADH (carbon in white) are shown as sticks.
Figure 7
Figure 7
(A) The crystallographic structure of the InhA homotetramer (PDB 1P44, 2.70 Å); (B) The structure and activity of the InhA inhibitors identified using the pharmacophore modeling and SBVS approaches.
Figure 8
Figure 8
(A) Structure of the proteasome inhibitor carfilzomib; (B) Crystallographic structure of the human 20S proteasome complexed to carfilzomib (PDB 4R67, 2.89 Å). The protein backbone is in cartoon representation. The ligand (carbon in salmon) and residues in the active site (carbon in yellow) are shown in stick representation. Water is shown as red spheres and hydrogen bonds are indicated as dashed lines; (C) Structure of the proteasome inhibitor bortezomib; (D) Crystallographic structure of a yeast 20S proteasome complexed to bortezomib (PDB 2F16, 2.80 Å). The ligand (carbon in cyan) is shown in stick representation.
Figure 9
Figure 9
Structures of G4 (A) and G4-1 (B), the most potent proteasome inhibitors identified by SBVS. Remaining CT-L (chymotrypsin-like) activity at 10 μM: 9.69% for G4 and 6.15% for G4-1.
Figure 10
Figure 10
(A) Structure of STAT3-β in complex with DNA (PDB 1BG1, 2.25 Å). The protein backbone is in cartoon representation (purple). The DNA strand is shown in green (deoxyribose), blue (purine and pyrimidine bases) and red (phosphates); (B) Structure of the STAT3 dimerization inhibitor STX-0119 identified by molecular docking studies.
Figure 11
Figure 11
Scheme of the multistage VS approach. Four compound collections were combined yielding a database containing approximately 20 million compounds. Three computational screening procedures were applied and followed by visual inspection. The overall process resulted in the selection of 47 compounds for biochemical evaluation.
Figure 12
Figure 12
(A) Crystallographic structure of Pim-1 kinase complexed to the inhibitor VX2 (PDB 3BGQ, 2.00 Å). The protein backbone is in cartoon representation. The inhibitor (carbon in orange) is shown as ball-and-sticks; (B) Structure of the Pim-1 inhibitor VX2.
Figure 13
Figure 13
Structures and biological activity data for the Pim-1 inhibitors identified in the ligand- and structure-based VS strategy.
Figure 14
Figure 14
(A) Crystallographic structure of ALR2 complexed to the inhibitor IDD594 and the enzyme cofactor NADP+ (PDB 1US0, 0.66 Å). The protein backbone is in cartoon representation. The inhibitor (carbon in magenta) and NADP+ (carbon in white) are shown as sticks; (B) Structure of the ALR2 inhibitor IDD594.
Figure 15
Figure 15
Structures and biological activity data for the ALR2 inhibitors identified by the VS strategy. Epalrestat (Kinedak®), a commercially available ALR2 inhibitor is also shown.
Figure 16
Figure 16
Structure and biological activity of the designed series of COX inhibitors.
Figure 17
Figure 17
(A) Structure of the COX inhibitor flurbiprofen; (B) Crystallographic structure of COX-1 complexed to flurbiprofen (PDB 3N8Z, 2.90 Å). The protein backbone is in cartoon representation. The ligand and residues in the active site are shown in stick representation. Hydrogen bonds are indicated as dashed lines; (C) Structure of the COX inhibitor naproxen; (D) Crystallographic structure of COX-2 complexed to naproxen (PDB 3NT1, 1.73 Å). The protein backbone is in cartoon representation. The ligand and residues in the active are shown in stick representation.

References

    1. Hughes J.P., Rees S., Kalindjian S.B., Philpott K.L. Principles of early drug discovery. Br. J. Pharmacol. 2011;162:1239–1249. doi: 10.1111/j.1476-5381.2010.01127.x. - DOI - PMC - PubMed
    1. Lipinski C.A., Lombardo F., Dominy B.W., Feeney P.J. Experimental and computational approaches to estimate solubility and permeability in drug discovery and development settings. Adv. Drug Deliv. Rev. 2012;64:4–17. doi: 10.1016/j.addr.2012.09.019. - DOI - PubMed
    1. Berman H.M. The protein data bank. Nucleic Acids Res. 2000;28:235–242. doi: 10.1093/nar/28.1.235. - DOI - PMC - PubMed
    1. Weigelt J. Structural genomics-Impact on biomedicine and drug discovery. Exp. Cell Res. 2010;316:1332–1338. doi: 10.1016/j.yexcr.2010.02.041. - DOI - PubMed
    1. Salum L., Polikarpov I., Andricopulo A.D. Structure-based approach for the study of estrogen receptor binding affinity and subtype selectivity. J. Chem. Inf. Model. 2008;48:2243–2253. doi: 10.1021/ci8002182. - DOI - PubMed

Publication types