Review
. 2016 Jan;44(1):222-33.
doi: 10.1007/s10439-015-1393-5. Epub 2015 Jul 24.

Predicting Knee Osteoarthritis

Affiliations
Review

Predicting Knee Osteoarthritis

Bruce S Gardiner et al. Ann Biomed Eng. 2016 Jan.

Abstract

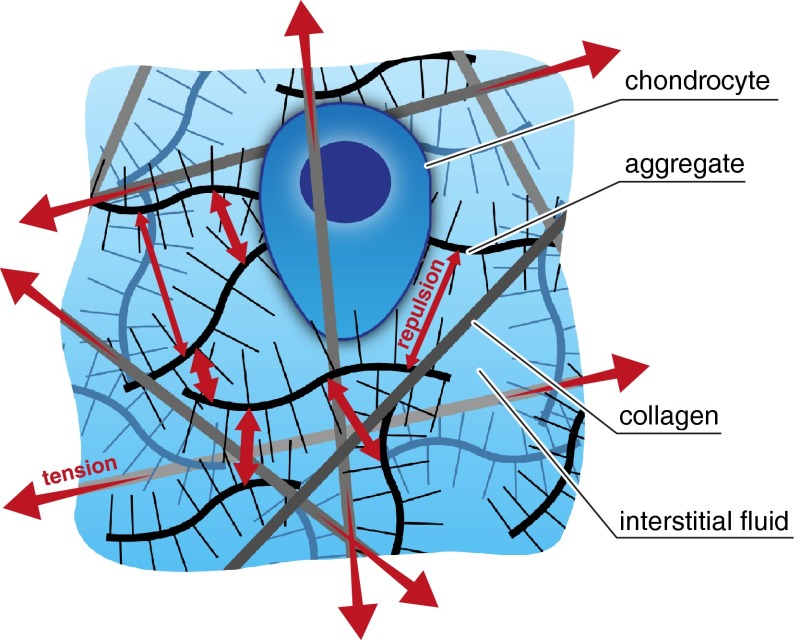
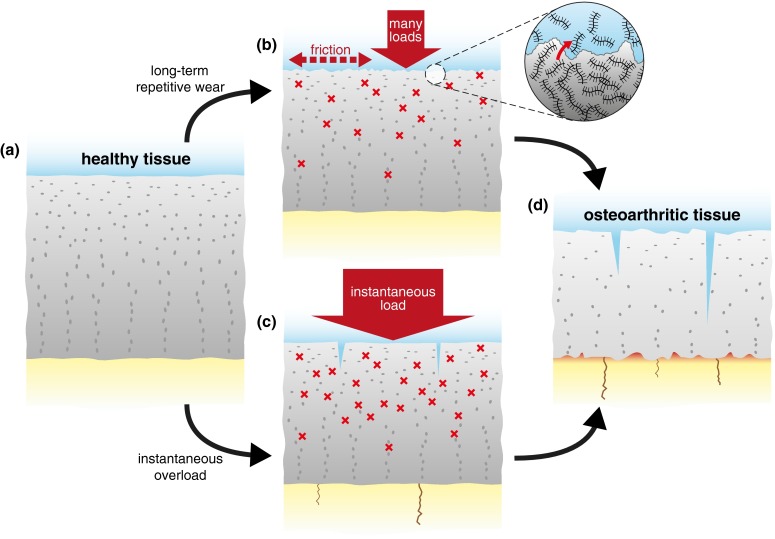
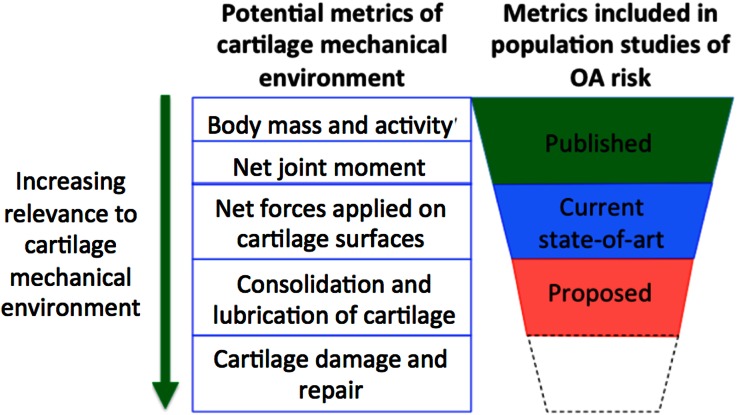
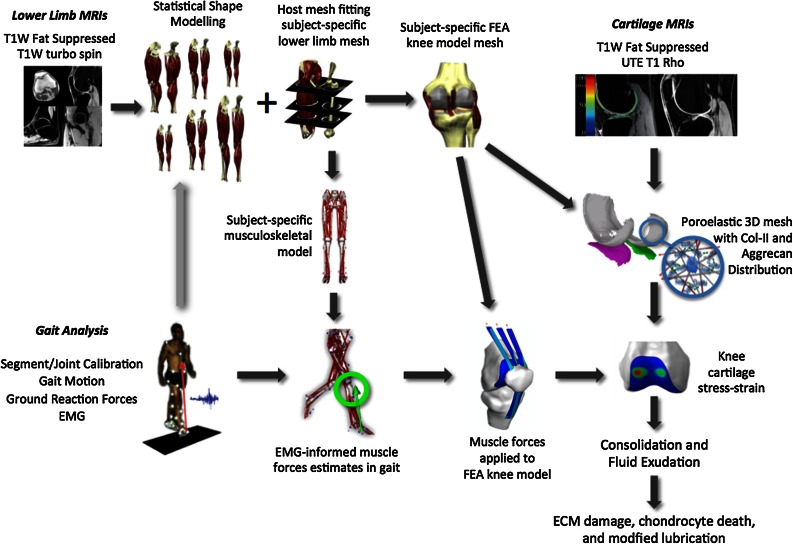
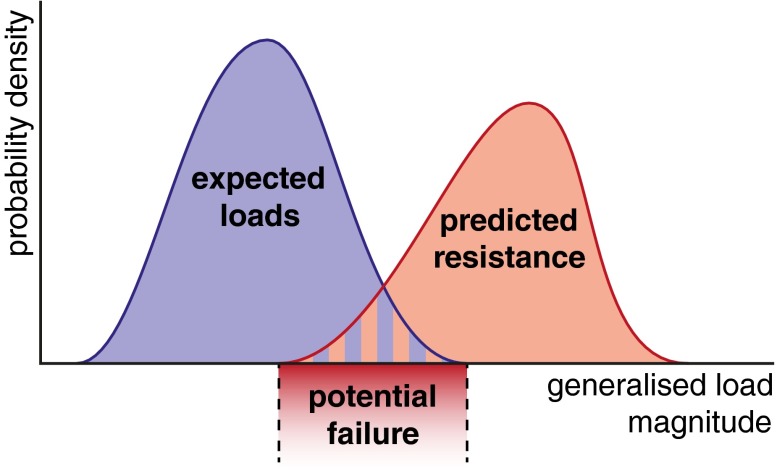
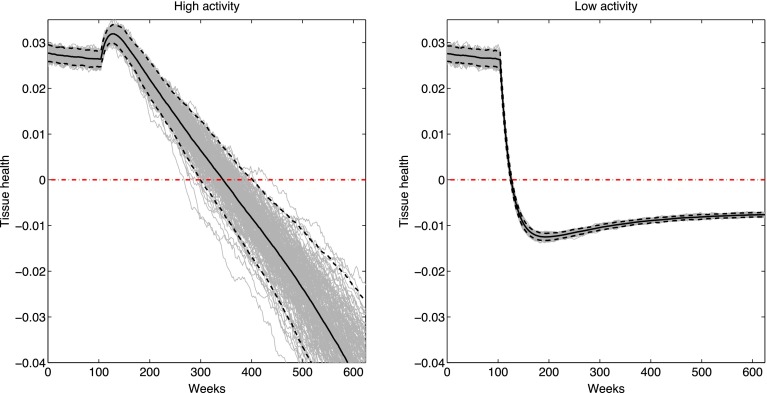
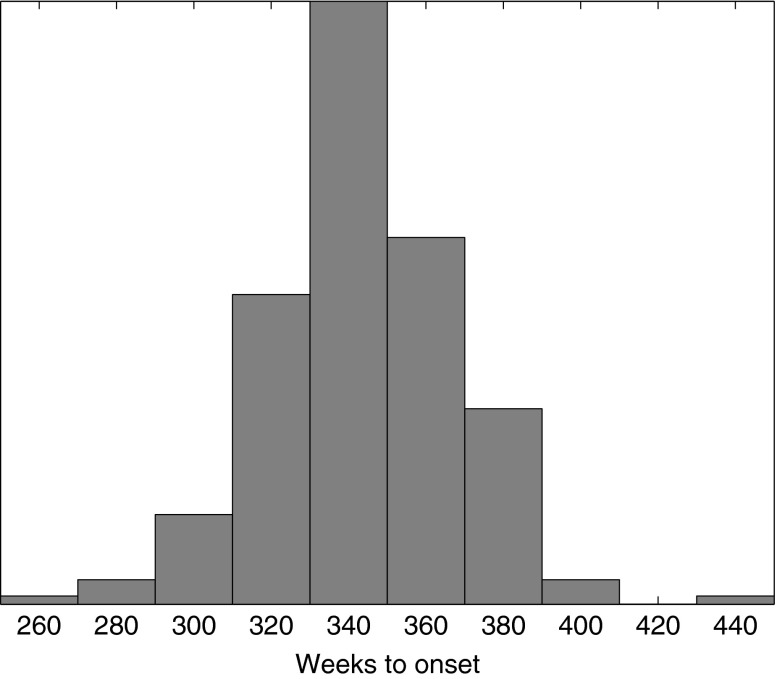
Treatment options for osteoarthritis (OA) beyond pain relief or total knee replacement are very limited. Because of this, attention has shifted to identifying which factors increase the risk of OA in vulnerable populations in order to be able to give recommendations to delay disease onset or to slow disease progression. The gold standard is then to use principles of risk management, first to provide subject-specific estimates of risk and then to find ways of reducing that risk. Population studies of OA risk based on statistical associations do not provide such individually tailored information. Here we argue that mechanistic models of cartilage tissue maintenance and damage coupled to statistical models incorporating model uncertainty, united within the framework of structural reliability analysis, provide an avenue for bridging the disciplines of epidemiology, cell biology, genetics and biomechanics. Such models promise subject-specific OA risk assessment and personalized strategies for mitigating or even avoiding OA. We illustrate the proposed approach with a simple model of cartilage extracellular matrix synthesis and loss regulated by daily physical activity.

Keywords: Biomechanical modeling; Cartilage degeneration; Extracellular matrix; Structural reliability analysis; Subject-specific risk prediction.


Figures

Figure 1
Figure 1
Aggrecan, produced by chondrocytes, carries a strong negative charge. The resulting repulsion (electrical and osmotic, represented by the small red arrows) gives cartilage a tendency to swell. The collagen network within the cartilage (anchored to the underlying bone) provides cartilage with tensile strength and constrains the swelling and release of aggrecan to the joint space. The collagen is therefore normally under tension (large red arrows). Illustration not to scale.
Figure 2
Figure 2
Illustration of two potential mechanically initiated failure pathways to OA. Note other pathways (not shown), either mechanical or non-mechanical, may also initiate OA. (a) Normal healthy cartilage may experience (b) long-term overuse or repetitive small loads, which causes wear at the cartilage surface and exposes chondrocytes to high strains by the resulting consolidation under cyclic loading. (c) Alternatively, healthy cartilage may experience a high impact (short-term) load leading to splits, chondrocyte death, cytokine release with protease-mediated ECM degradation, and damage to the subchondral bone. (d) Ultimately, both routes result in failure as the cartilage repair capacity is exceeded.
Figure 3
Figure 3
Conceptualizing cartilage mechanical environment metrics that incorporate more known factors.
Figure 4
Figure 4
Workflow for integrating imaging, gait and cartilage quality data into a multiscale subject-specific model of human knee cartilage. For further discussion on each component, see host-mesh fitting, EMG-informed muscle forces in gait, knee cartilage stress–strain,, and poroelastic models of cartilage.,, We argue that tissue-level metrics of cartilage consolidation and fluid exudation will have a stronger association with cartilage loss and defect enlargement than risk factors used in previous studies.
Figure 5
Figure 5
Structural reliability analysis: the risk of failure increases as the distribution of expected loads increasingly overlaps the distribution of the expected ultimate load of the structure (resistance). The load measure need not be a pressure or force, but rather some generalized measure of the duress under which the structure has been placed.
Figure 6
Figure 6
Cartilage health (as defined in the text) during an abrupt shift from medium to high activity (left) or from medium to low activity (right). Grey lines are individual activity realizations; solid black lines are the means over all realizations, with 95% confidence intervals in dashed black lines. Red dash-dotted line indicates the zero health OA danger threshold.
Figure 7
Figure 7
Distribution of OA danger threshold hitting times in the high activity example of Fig. 6.

References

    1. Adams MA. The mechanical environment of chondrocytes in articular cartilage. Biorheology. 2006;43:537–545. - PubMed
    1. Anderson AS, Loeser RF. Why is osteoarthritis an age-related disease? Best Pract. Res. Clin. Rheumatol. 2010;24:15–26. doi: 10.1016/j.berh.2009.08.006. - DOI - PMC - PubMed
    1. Aspden RM. Obesity punches above its weight in osteoarthritis. Nat. Rev. Rheumatol. 2011;7:65–68. doi: 10.1038/nrrheum.2010.123. - DOI - PubMed
    1. Baecher GB, Christian JT. Reliability and Statistics in Geotechnical Engineering. West Sussex: Wiley; 2003.
    1. Barenius B, Ponzer S, Shalabi A, Bujak R, Norlén L, Eriksson K. Increased risk of osteoarthritis after anterior cruciate ligament reconstruction: a 14-year follow-up study of a randomized controlled trial. Am. J. Sports Med. 2014;42:1049–1057. doi: 10.1177/0363546514526139. - DOI - PubMed

Publication types

LinkOut - more resources