

DGCR8 is essential for tumor progression following PTEN loss in the prostate
- PMID: 26206718
- PMCID: PMC4576988
- DOI: 10.15252/embr.201439925
DGCR8 is essential for tumor progression following PTEN loss in the prostate
Abstract
In human prostate cancer, the microRNA biogenesis machinery increases with prostate cancer progression. Here, we show that deletion of the Dgcr8 gene, a critical component of this complex, inhibits tumor progression in a Pten-knockout mouse model of prostate cancer. Early stages of tumor development were unaffected, but progression to advanced prostatic intraepithelial neoplasia was severely inhibited. Dgcr8 loss blocked Pten null-induced expansion of the basal-like, but not luminal, cellular compartment. Furthermore, while late-stage Pten knockout tumors exhibit decreased senescence-associated beta-galactosidase activity and increased proliferation, the simultaneous deletion of Dgcr8 blocked these changes resulting in levels similar to wild type. Sequencing of small RNAs in isolated epithelial cells uncovered numerous miRNA changes associated with PTEN loss. Consistent with a Pten-Dgcr8 association, analysis of a large cohort of human prostate tumors shows a strong correlation between Akt activation and increased Dgcr8 mRNA levels. Together, these findings uncover a critical role for microRNAs in enhancing proliferation and enabling the expansion of the basal cell compartment associated with tumor progression following Pten loss.
Keywords: DGCR8; PTEN; microRNA; microRNA biogenesis; prostate cancer.
© 2015 The Authors.
Figures

Staining for DGCR8 protein in prostates. Upper images: immunohistochemical staining using the Aviva Systems Biology antibody (scale bar, 100 μm). Wild-type and PtenΔ/Δ prostates have DGCR8-positive nuclei in both the basal and luminal cells as well as surrounding stromal cells. Dgcr8Δ/Δ and PtenΔ/Δ Dgcr8Δ/Δ prostates show diminished DGCR8 nuclear staining in both basal and luminal cells, but not stromal cells. Cytoplasmic signal is non-specific. Representative images of at least two mice of each genotype from the old cohort were analyzed. Lower images: immunofluorescent staining for DGCR8 expression using the Proteintech Group antibody (scale bar, 100 μm). DAPI and DGCR8 channels from the same field of view are shown. DAPI staining shows the position of nuclei. The inset shows representative cells 3× zoomed. Arrows indicate cells with positive nuclear stain, and arrowheads indicate cells lacking nuclear stain. Representative images of at least two mice of each genotype from the young cohort were analyzed.
Relative levels of Dgcr8 transcript in PtenΔ/Δ Dgcr8Δ/Δ versus PtenΔ/Δ alone. qRT–PCR for Dgcr8 exon 3 expression was performed on RNA prepared from frozen sections of 3 mice of each genotype.
Relative expression levels of 55 miRNAs in PtenΔ/Δ Dgcr8Δ/Δ versus PtenΔ/Δ alone. Multiplex qRT–PCR data for three individuals of each genotype as in (B). Ct values were normalized to Sno202 levels. Error bars represent standard deviation.
Representative confocal images of pAKT staining. Immunofluorescent staining of pAKT expression reveals strong expression in PtenΔ/Δ and PtenΔ/Δ Dgcr8Δ/Δ prostates compared to wild type and Dgcr8Δ/Δ. AKT phosphorylation is directly downstream of PTEN and is activated upon PTEN loss. Shown are representative images taken from at least two mice per genotype in the old cohort using the Olympus confocal microscope as described in Materials and Methods (scale bar, 100 μm). See FigEV1 for representative low-magnification images from young and old cohorts.
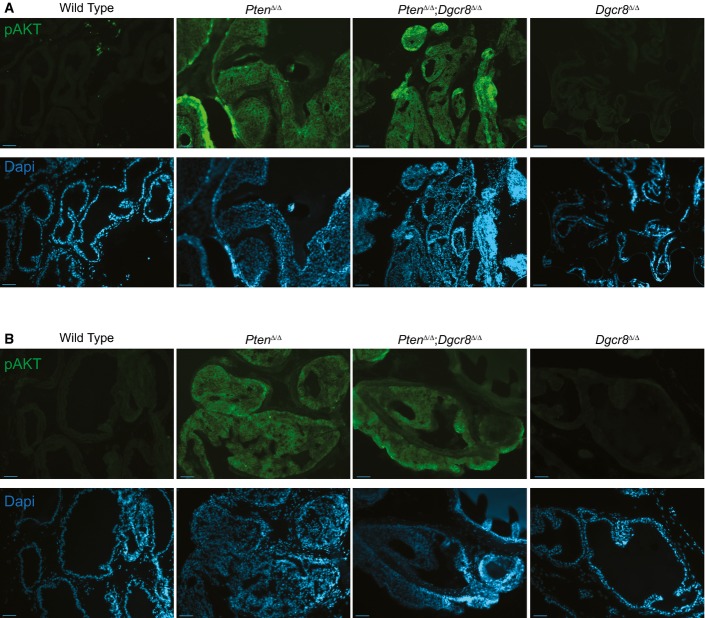
A, B Representative epi-fluorescent images from the young (A) and old (B) cohort at low magnification. Upper panels in green show pAKT Ser373 expression. Lower panels in blue show corresponding DAPI images (scale bar, 500 μm).

A Representative images of prostates from each genotype. Upper panels: young cohort; lower panels: old cohort. Note large bilateral tumors in old PtenΔ/Δ prostates and smaller bilateral tumors in the young PtenΔ/Δ animals. Other genotypes show examples of normal appearing prostates (scale bar, 100 μm). See FigEV2A for breakdown of individual mice by age and genotype.
B, C Quantification of tumor incidence (green) represented as percentage of total in the young (B) and old (C) cohorts. The number of mice with each phenotype is shown within bars. Statistical differences were calculated by the Fisher’s exact test. n.s. P > 0.05, *P < 0.05, **P < 0.005, ***P < 0.0005.
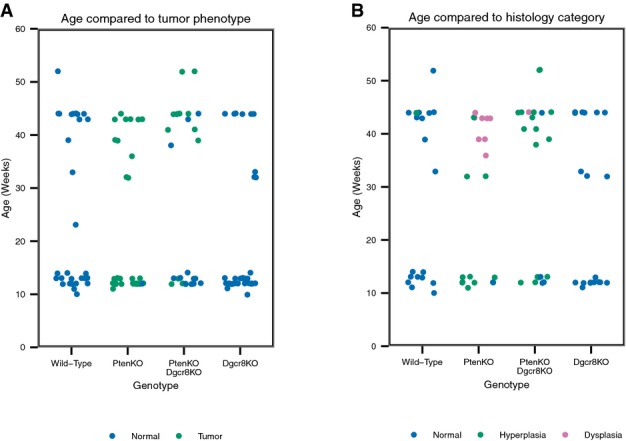
Tumor phenotype as seen on gross inspection for all mice in Fig2B and C. Blue, no tumor; green, tumor.
Histology phenotype as seen on H&E sections for all mice in Fig3B and C. Blue, normal; green, hyperplasia; purple, dysplasia.

A Categorization of histological phenotypes. Shown are representative images of different histological phenotypes at low and high magnification (scale bar, 100 μm). All sections were stained with hematoxylin/eosin. See text for description of histological features used to define normal, hyperplasia, and dysplasia categories.
B, C Characterization and quantification of histology on representative young mice from Fig2B and old mice in Fig2C. All slides were evaluated and scored by two pathologists blinded to genetic background. Statistical differences were calculated by a modified Freeman-Halton extension of the Fisher’s exact test. n.s. P > 0.05, *P < 0.05, **P < 0.005, ***P < 0.0005. See Fig EV2B for breakdown of individual mice by age and genotype.

Representative confocal images of basal (CK5; green) and luminal (CK8; red) cell populations in indicated genotypes from the old cohort. Nuclei are stained with the DNA dye ToPro3 (blue) (scale bar, 100 μm).
Quantification of basal and luminal cell compartments. The extent of basal and luminal expansion was measured by counting the number of cells staining positive for either CK5 (basal cells) or CK8 (luminal cells) in 63× images taken at the junction of the dorsal–lateral and anterior prostate lobes. Four images from four individual mice were evaluated per genotype for a total of at least 16 microscopic fields of view per genotype. Mean ± standard deviation is shown. The statistical significance was calculated using Student’s t-test. n.s. P > 0.05, *P < 0.05, **P < 0.005, ***P < 0.0005.

A, B Representative low-magnification epi-fluorescent images of basal (CK5; green) and luminal (CK8; red) cell populations in indicated genotypes from the young cohort (A) and the old cohort (B). Nuclei are stained with the DAPI (blue) (scale bars, 500 μm). Note expansion of basal cells in old Pten null mice, which is not seen in other genotypes. Quantification of old mice is shown in Fig5B.

Senescence: Staining for SA-β-gal (blue). Counter-stained with Nuclear Fast Red. Representative images at 10× magnification are shown.
Quantification of SA-β-gal-positive cells. Two slides of all old mice shown in Fig2C were counted. The percentages of SA-β-gal-positive cells were calculated as the ratio of β-Gal-positive out of 500 cells total counted per animal. A total of 250 cells were counted on both the right and the left proximal anterior prostate and adjacent dorsal–lateral prostate in the section. Four mice of each genotype were counted. Mean ± SD is shown. Student’s t-test was used to calculate statistical significance. Wild type, PtenΔ/Δ Dgcr8Δ/Δ, and Dgcr8Δ/Δ were not statistically different from each other. n.s. P > 0.05, *P < 0.05, **P < 0.005, ***P < 0.0005.
Representative confocal images of proliferation marker Ki67 green with DAPI-stained nuclei overlay (scale bar, 100 μm).
Quantification of Ki67 staining. The percentage of Ki67 was calculated by determining the ratio of Ki67-positive to all ToPro3-labeled nuclei in the prostate glands. At least four images from four individuals of each genotype were counted. Images were taken in approximately the same location in each prostate at the junction of the dorsal–lateral and anterior prostate lobes. Mean ± SD is shown. Student’s t-test was used to calculate statistical significance. Wild type, PtenΔ/Δ Dgcr8Δ/Δ, and Dgcr8Δ/Δ were not statistically different from each other. n.s. P > 0.05, *P < 0.05, **P < 0.005, ***P < 0.0005.

A, B Representative low-magnification epi-fluorescent images of Ki67 (green) staining in prostates from the young cohort (A) and from the old cohort (B). Nuclei are stained with the DAPI (blue) (scale bar, 500 μm). Note increased proliferation in both young and old Pten null mice relative to other genotypes. Quantification of old mice is shown in Fig5D.

Scheme to isolate Pten-deficient epithelial cells from mouse prostate. Prostates were isolated from 12-week-old transgenic mice expressing Probasin-Cre and the Rosa26lox-stop-lox-YFP reporter allele plus and minus the Ptenflox/flox allele. YFP-positive cells were isolated using fluorescence-activated cell sorting technology. RNA was isolated and small RNA libraries were submitted for deep sequencing analysis.
Volcano scatter plot of log2-fold difference between wild type and PtenΔ/Δ versus log10 P-values. microRNAs with differences > 2-fold and q-value < 0.05 are highlighted and labeled. Q-values were determined using Benjamini–Hochberg procedure.
Scatterplot of log2 counts per million (cpm) expression values of subset of miRNAs with q-values < 0.05 and average counts in at least one group of > 100 cpm. The black bar represents the mean of the three values for each genotype.


Scatterplot of DGCR8 mRNA expression versus PARADIGM-inferred AKT2 IPL in 334 TCGA PRAD cases.
Boxplot showing DGCR8 mRNA expression within AKT2 IPLs defined subgroups.
Scatterplot of DGCR8 mRNA expression versus pAKT-pT308 protein levels.
References
Publication types
MeSH terms
Substances
Grants and funding
LinkOut - more resources
Full Text Sources
Other Literature Sources
Medical
Molecular Biology Databases
Research Materials
