

Design of Albumin-Coated Microbubbles Loaded With Polylactide Nanoparticles
- PMID: 26206822
- PMCID: PMC4536807
- DOI: 10.7863/ultra.34.8.1363
Design of Albumin-Coated Microbubbles Loaded With Polylactide Nanoparticles
Abstract
Objectives: A protocol was designed to produce albumin-coated microbubbles (MBs) loaded with functionalized polylactide (PLA) nanoparticles (NPs) for future drug delivery studies.
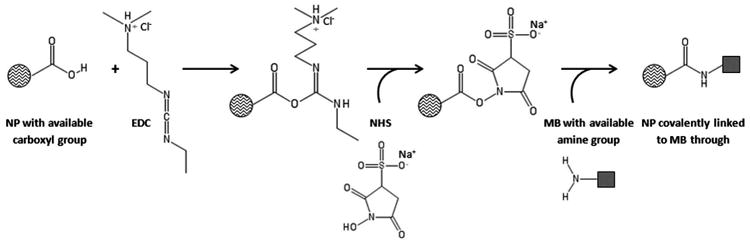
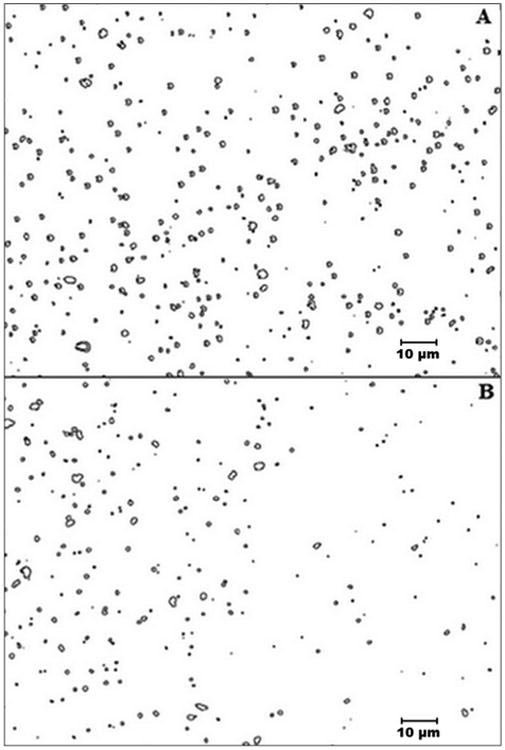
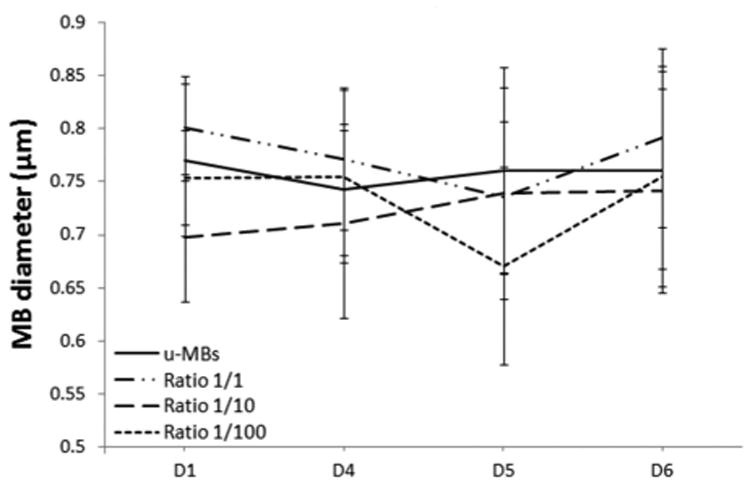
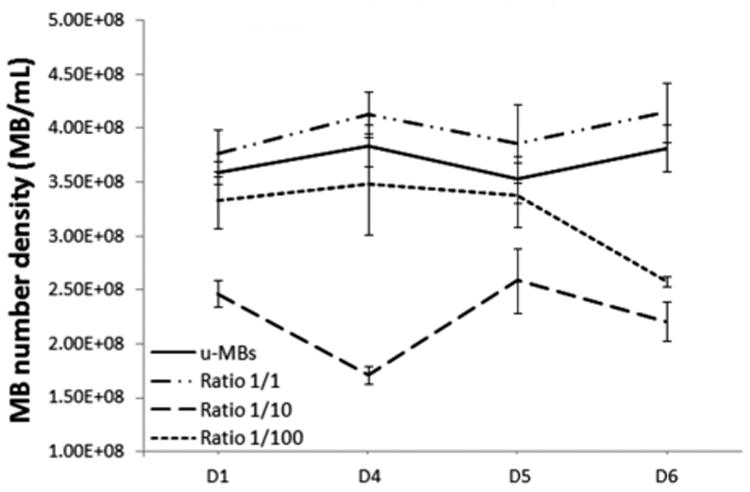
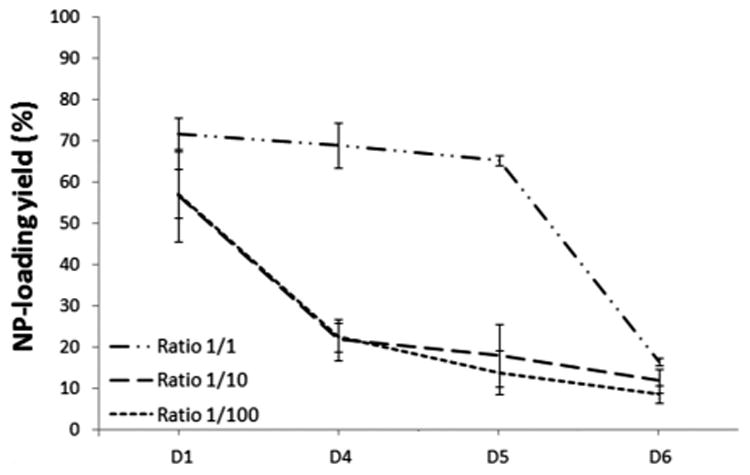
Methods: Microbubbles resulted from the sonication of 5% bovine serum albumin and 15% dextrose solution. Functionalized NPs were produced by mixing fluorescent PLA and PLA-polyethylene glycol-carboxylate conjugates. Nanoparticle-loaded MBs resulted from the covalent conjugation of functionalized NPs and MBs. Three NP/MB volume ratios (1/1, 1/10, and 1/100) and unloaded MBs were produced and compared. Statistical evaluations were based on quantitative analysis of 3 parameters at 4 time points (1, 4, 5, and 6 days post MB fabrication): MB diameter using a circle detection routine based on the Hough transform, MB number density using a hemocytometer, and NP-loading yield based on MB counts from fluorescence and light microscopic images. Loading capacity of the albumin-coated MBs was evaluated by fluorescence.
Results: Loaded MB sizes were stable over 6 days after production and were not significantly different from that of time-matched unloaded MBs. Number density evaluation showed that only 1/1 NP/MB volume ratio and unloaded MB number densities were stable over time, and that the 1/1 MB number density evaluated at each time point was not significantly different from that of unloaded MBs. The 1/10 and 1/100 NP/MB volume ratios had unstable number densities that were significantly different from that of unloaded MBs (P < .05). Fluorescence evaluation suggested that 1/1 MBs had a higher NP-loading yield than 1/10 and 1/100 MBs. Quantitative loading evaluation suggested that the 1/1 MBs had a loading capacity of 3700 NPs/MB.
Conclusions: A protocol was developed to load albumin MBs with functionalized PLA NPs for further drug delivery studies. The 1/1 NP/MB volume ratio appeared to be the most efficient to produce stable loaded MBs with a loading capacity of 3700 NPs/MB.
Keywords: fluorescence; functionalized nanoparticles; microbubbles; stability.
© 2015 by the American Institute of Ultrasound in Medicine.
Figures
Similar articles
-
A Novel Microbubble Capable of Ultrasound-Triggered Release of Drug-Loaded Nanoparticles.J Biomed Nanotechnol. 2016 Mar;12(3):516-24. doi: 10.1166/jbn.2016.2181. J Biomed Nanotechnol. 2016. PMID: 27280249
-
Dual-functionalized nanoparticles loaded microbubbles for enhancement of drug uptake.Ultrasonics. 2018 Jul;87:82-90. doi: 10.1016/j.ultras.2018.02.003. Epub 2018 Feb 5. Ultrasonics. 2018. PMID: 29475016
-
Production of uniformly sized serum albumin and dextrose microbubbles.Ultrason Sonochem. 2012 Jan;19(1):198-208. doi: 10.1016/j.ultsonch.2011.05.010. Epub 2011 May 27. Ultrason Sonochem. 2012. PMID: 21689961 Free PMC article.
-
Influence of DNA-Microbubble Coupling on Contrast Ultrasound-Mediated Gene Transfection in Muscle and Liver.J Am Soc Echocardiogr. 2016 Aug;29(8):812-818. doi: 10.1016/j.echo.2016.04.011. Epub 2016 Jun 4. J Am Soc Echocardiogr. 2016. PMID: 27267307 Free PMC article.
-
Effects of encapsulated gas on stability of lipid-based microbubbles and ultrasound-triggered drug delivery.J Control Release. 2019 Oct;311-312:65-73. doi: 10.1016/j.jconrel.2019.08.023. Epub 2019 Aug 25. J Control Release. 2019. PMID: 31461665
References
-
- Miyazaki S, Hou WM, Takada M. Controlled drug release by ultrasound irradiation. Chem Pharm Bull (Tokyo) 1985;33:428–431. - PubMed
-
- Ward M, Wu J, Chiu JF. Ultrasound-induced cell lysis and sonoporation enhanced by contrast agents. J Acoust Soc Am. 1999;105:2951–2957. - PubMed
-
- Chen Y, Jungsuwadee P, Vore M, Butterfield DA, St Clair DK. Collateral damage in cancer chemotherapy: oxidative stress in nontargeted tissues. Mol Interv. 2007;7:147–156. - PubMed
-
- Carvalho C, Santos RX, Cardoso S, et al. Doxorubicin: the good, the bad and the ugly effect. Curr Med Chem. 2009;16:3267–3285. - PubMed
Publication types
MeSH terms
Substances
Grants and funding
LinkOut - more resources
Full Text Sources
Other Literature Sources
Miscellaneous
