

Persistent hyperglycemia modulates gut immune function and microbiota in rats
- PMID: 26207186
- PMCID: PMC4511975
- DOI: 10.1186/s40560-015-0101-8
Persistent hyperglycemia modulates gut immune function and microbiota in rats
Abstract
Background: Since hyperglycemia-induced cellular dysfunction could be associated with alterations of the immune system, we tested the hypothesis that hyperglycemia augments the aberrant immune responses such as inflammation and differentiation of CD4(+) T lymphocytes in the mesenteric lymph nodes (MLNs), and induces alterations of microbiota both under physiological and pathological conditions.
Methods: Male Wistar rats were randomly allocated into 4 groups: Control and Endotoxemia (lipopolysaccharide, LPS 1 mg/kg) with or without hyperglycemia. The hyperglycemia groups were administered glucose solution (10-40 %), while the normoglycemia groups were administered saline. Alterations of the mRNA expressions of inflammatory cytokines and CD4(+) T lymphocyte transcriptional factor expressions in the MLNs, and those of the intestinal microbiota were analyzed at 24 hr.
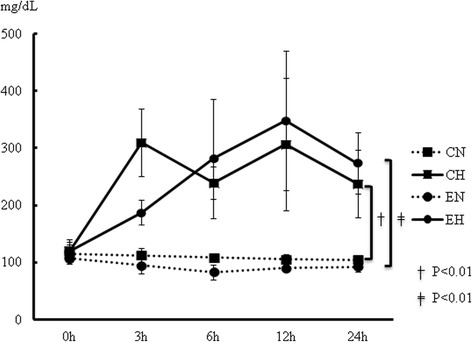
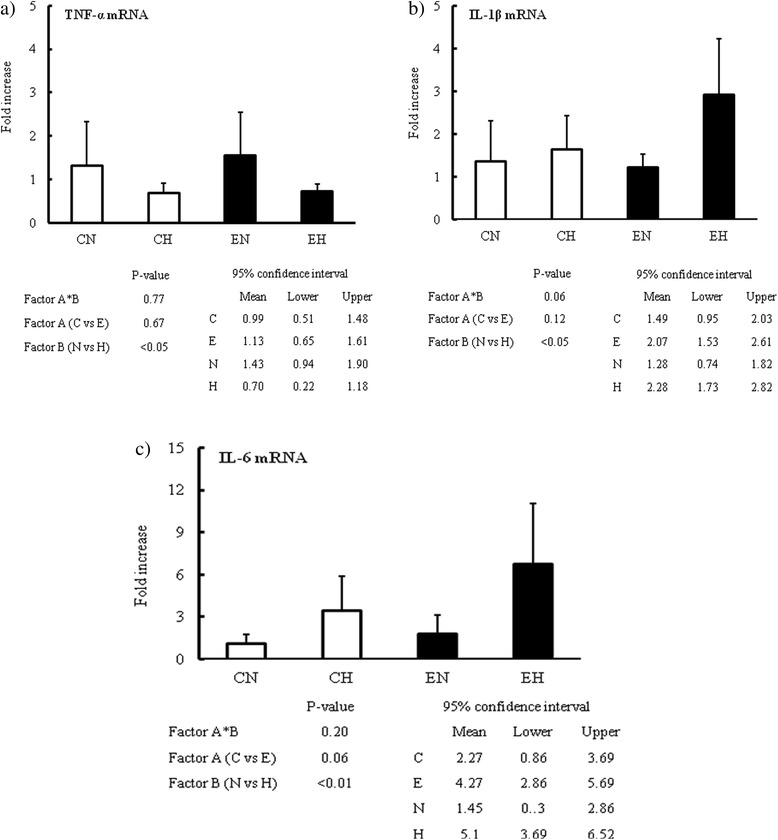
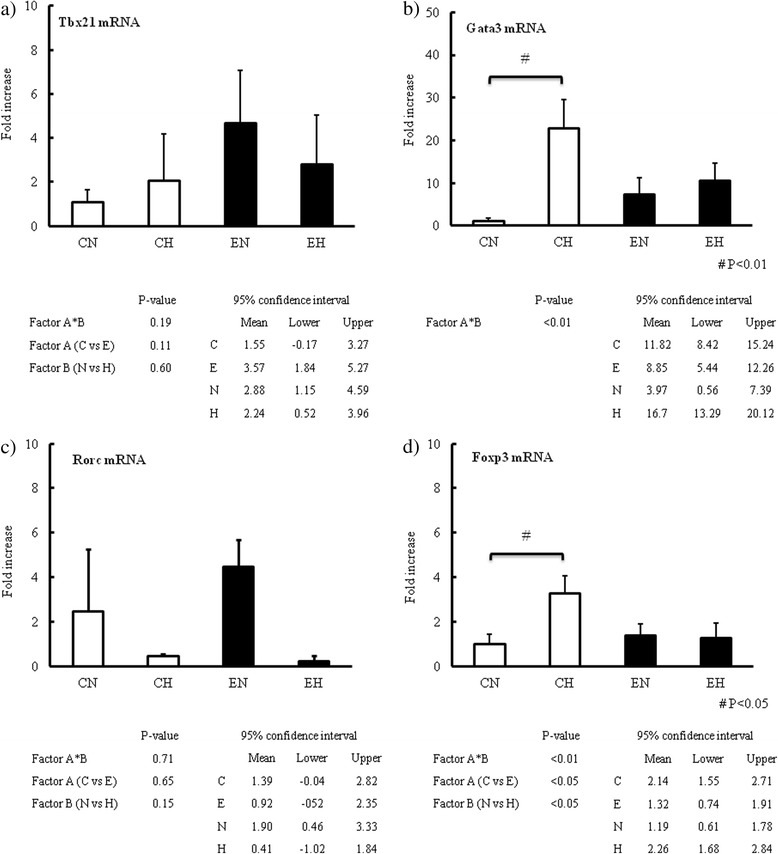
Results: Hyperglycemia was kept approximately 250-350 mg/dL during the 24 hr study period. At the end of 24 hr, hyperglycemia augmented the mRNA expressions of interleukin (IL)-1β and IL-6 in the MLNs, while both the helper T (Th) 2 and regulatory-T (Treg) transcriptional factors were simultaneously up-regulated under non-endotoxemic condition. LPS injection significantly modulated the obligate anaerobe bacterial populations of the Bacteroidetes class, and altered the population sizes of the Clostridium perfringens and the Bacteroides fragilis subgroup. Hyperglycemia did not enhance these alterations of the microbiota evoked by LPS, although it did modify the bacterial populations of the L. reuteri subgroup and staphylococci in healthy condition without endotoxemia.
Conclusions: The present study indicates that both gut immune function and microbiota are significantly modulated by persistent hyperglycemia.
Keywords: CD4+ T lymphocyte subsets; Gut barrier function; Mesenteric lymph nodes; Pro-inflammatory cytokine.
Figures

Similar articles
-
Tumor necrosis factor-alpha mediates hyperglycemia-augmented gut barrier dysfunction in endotoxemia.Crit Care Med. 2009 Mar;37(3):1024-30. doi: 10.1097/CCM.0b013e31819b53b6. Crit Care Med. 2009. PMID: 19237913
-
Pro-Inflammatory Th1 and Th17 Cells Are Suppressed During Human Experimental Endotoxemia Whereas Anti-Inflammatory IL-10 Producing T-Cells Are Unaffected.Front Immunol. 2018 May 18;9:1133. doi: 10.3389/fimmu.2018.01133. eCollection 2018. Front Immunol. 2018. PMID: 29868038 Free PMC article.
-
Differential Dynamics of Regulatory T-Cell and Th17 Cell Balance in Mesenteric Lymph Nodes and Blood following Early Antiretroviral Initiation during Acute Simian Immunodeficiency Virus Infection.J Virol. 2019 Sep 12;93(19):e00371-19. doi: 10.1128/JVI.00371-19. Print 2019 Oct 1. J Virol. 2019. PMID: 31315987 Free PMC article.
-
Re-thinking the functions of IgA(+) plasma cells.Gut Microbes. 2014;5(5):652-62. doi: 10.4161/19490976.2014.969977. Gut Microbes. 2014. PMID: 25483334 Free PMC article. Review.
-
Mucosal immunoregulation: environmental lipopolysaccharide and GALT T lymphocytes regulate the IgA response.Microbiol Immunol. 1984;28(3):261-80. doi: 10.1111/j.1348-0421.1984.tb00679.x. Microbiol Immunol. 1984. PMID: 6234450 Review.
Cited by
-
Construction of a potentially functional lncRNA-miRNA-mRNA network in sepsis by bioinformatics analysis.Front Genet. 2022 Nov 15;13:1031589. doi: 10.3389/fgene.2022.1031589. eCollection 2022. Front Genet. 2022. PMID: 36457745 Free PMC article.
-
The ambiguous role of obesity in oncology by promoting cancer but boosting antitumor immunotherapy.J Biomed Sci. 2022 Feb 14;29(1):12. doi: 10.1186/s12929-022-00796-0. J Biomed Sci. 2022. PMID: 35164764 Free PMC article. Review.
-
Diabetes mellitus exacerbates experimental autoimmune myasthenia gravis via modulating both adaptive and innate immunity.J Neuroinflammation. 2021 Oct 26;18(1):244. doi: 10.1186/s12974-021-02298-6. J Neuroinflammation. 2021. PMID: 34702288 Free PMC article.
References
-
- Gonzalez Y, Herrera MT, Soldevila G, Garcia-Garcia L, Fabián G, Pérez-Armendariz EM, Bobadilla K, Guzmán-Beltrán S, Sada E, Torres M. High glucose concentrations induce TNF-α production through the down-regulation of CD33 in primary human monocytes. BMC Immunol. 2012;13:19. doi: 10.1186/1471-2172-13-19. - DOI - PMC - PubMed
LinkOut - more resources
Full Text Sources
Other Literature Sources
Research Materials
