

Chlamydia trachomatis In Vivo to In Vitro Transition Reveals Mechanisms of Phase Variation and Down-Regulation of Virulence Factors
- PMID: 26207372
- PMCID: PMC4514472
- DOI: 10.1371/journal.pone.0133420
Chlamydia trachomatis In Vivo to In Vitro Transition Reveals Mechanisms of Phase Variation and Down-Regulation of Virulence Factors
Abstract
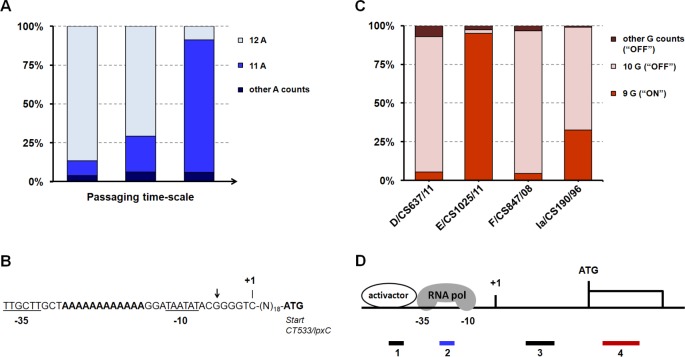
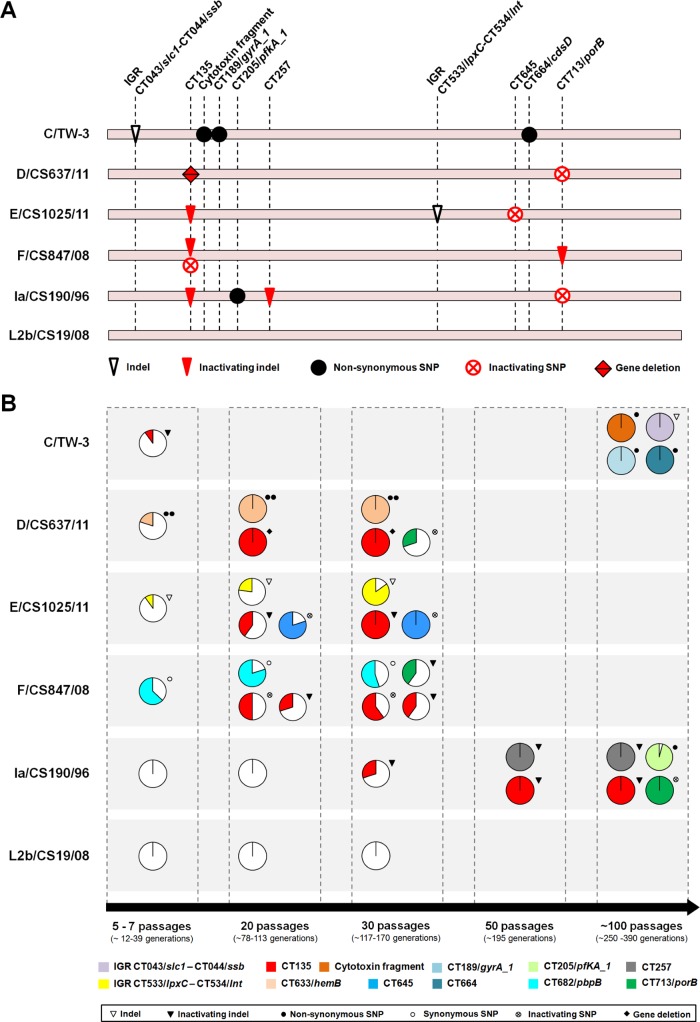
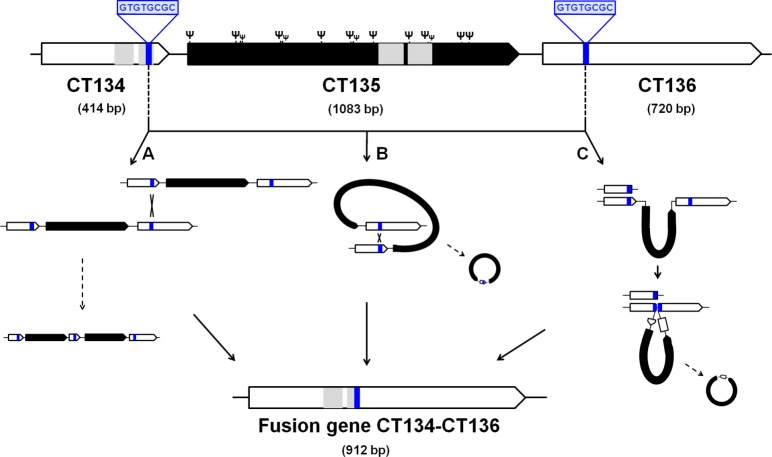
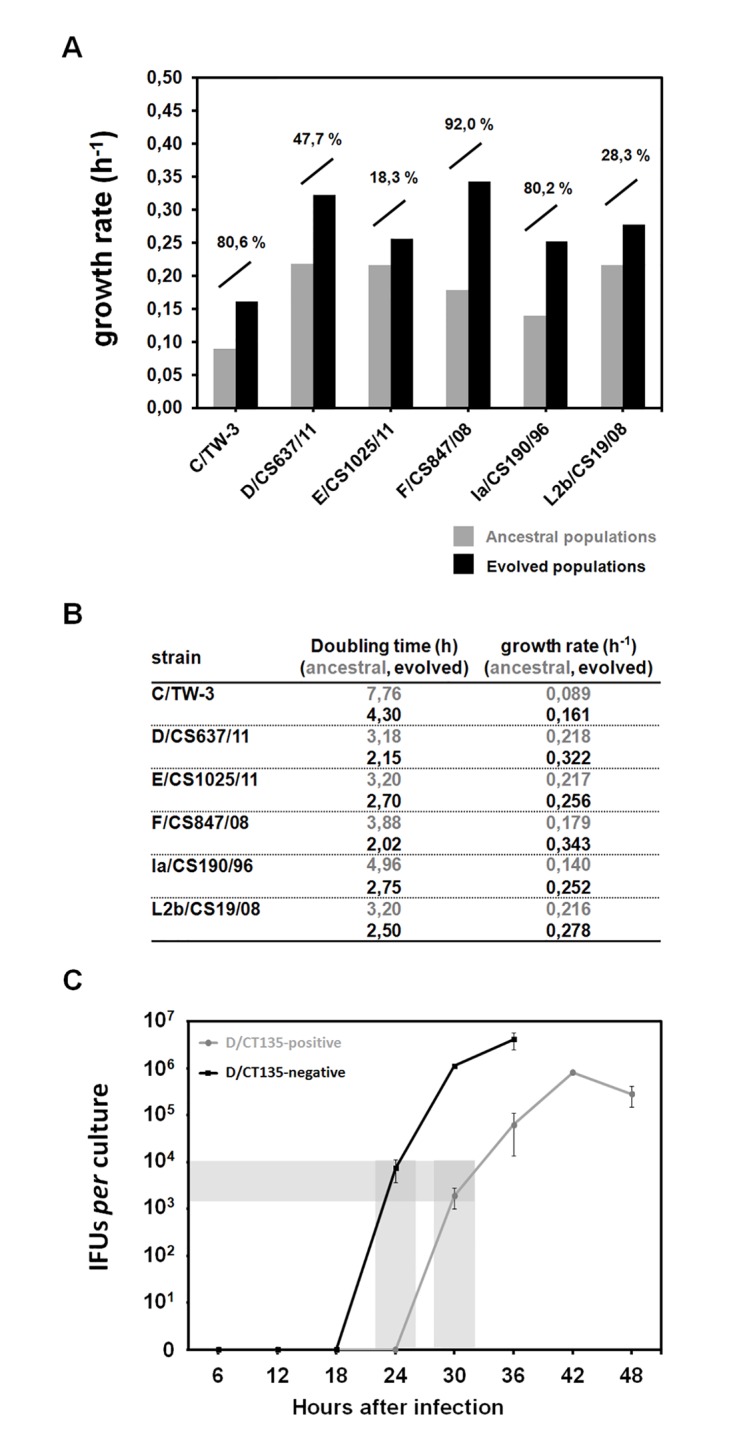
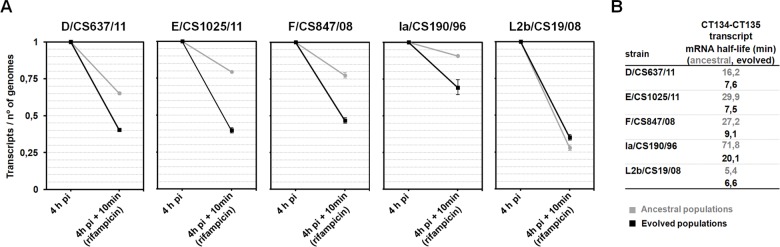
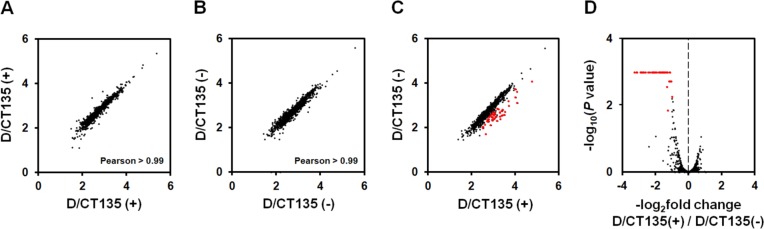
Research on the obligate intracellular bacterium Chlamydia trachomatis demands culture in cell-lines, but the adaptive process behind the in vivo to in vitro transition is not understood. We assessed the genomic and transcriptomic dynamics underlying C. trachomatis in vitro adaptation of strains representing the three disease groups (ocular, epithelial-genital and lymphogranuloma venereum) propagated in epithelial cells over multiple passages. We found genetic features potentially underlying phase variation mechanisms mediating the regulation of a lipid A biosynthesis enzyme (CT533/LpxC), and the functionality of the cytotoxin (CT166) through an ON/OFF mechanism. We detected inactivating mutations in CT713/porB, a scenario suggesting metabolic adaptation to the available carbon source. CT135 was inactivated in a tropism-specific manner, with CT135-negative clones emerging for all epithelial-genital populations (but not for LGV and ocular populations) and rapidly increasing in frequency (~23% mutants per 10 passages). RNA-sequencing analyses revealed that a deletion event involving CT135 impacted the expression of multiple virulence factors, namely effectors known to play a role in the C. trachomatis host-cell invasion or subversion (e.g., CT456/Tarp, CT694, CT875/TepP and CT868/ChlaDub1). This reflects a scenario of attenuation of C. trachomatis virulence in vitro, which may take place independently or in a cumulative fashion with the also observed down-regulation of plasmid-related virulence factors. This issue may be relevant on behalf of the recent advances in Chlamydia mutagenesis and transformation where culture propagation for selecting mutants/transformants is mandatory. Finally, there was an increase in the growth rate for all strains, reflecting gradual fitness enhancement over time. In general, these data shed light on the adaptive process underlying the C. trachomatis in vivo to in vitro transition, and indicates that it would be prudent to restrict culture propagation to minimal passages and check the status of the CT135 genotype in order to avoid the selection of CT135-negative mutants, likely originating less virulent strains.
Conflict of interest statement
Figures
Similar articles
-
Chlamydia trachomatis virulence factor CT135 is stable in vivo but highly polymorphic in vitro.Pathog Dis. 2015 Aug;73(6):ftv043. doi: 10.1093/femspd/ftv043. Epub 2015 Jun 24. Pathog Dis. 2015. PMID: 26109550 Free PMC article.
-
Deep comparative genomics among Chlamydia trachomatis lymphogranuloma venereum isolates highlights genes potentially involved in pathoadaptation.Infect Genet Evol. 2015 Jun;32:74-88. doi: 10.1016/j.meegid.2015.02.026. Epub 2015 Mar 3. Infect Genet Evol. 2015. PMID: 25745888
-
Effect of long-term laboratory propagation on Chlamydia trachomatis genome dynamics.Infect Genet Evol. 2013 Jul;17:23-32. doi: 10.1016/j.meegid.2013.03.035. Epub 2013 Mar 28. Infect Genet Evol. 2013. PMID: 23542454
-
Genomic features beyond Chlamydia trachomatis phenotypes: what do we think we know?Infect Genet Evol. 2013 Jun;16:392-400. doi: 10.1016/j.meegid.2013.03.018. Epub 2013 Mar 21. Infect Genet Evol. 2013. PMID: 23523596 Review.
-
High-resolution typing of Chlamydia trachomatis: epidemiological and clinical uses.Curr Opin Infect Dis. 2015 Feb;28(1):61-71. doi: 10.1097/QCO.0000000000000129. Curr Opin Infect Dis. 2015. PMID: 25490105 Review.
Cited by
-
The multiple functions of the numerous Chlamydia trachomatis secreted proteins: the tip of the iceberg.Microb Cell. 2019 Aug 21;6(9):414-449. doi: 10.15698/mic2019.09.691. Microb Cell. 2019. PMID: 31528632 Free PMC article. Review.
-
Purification of Tag-Free Chlamydia trachomatis Scc4 for Structural Studies Using Sarkosyl-Assisted on-Column Complex Dissociation.Biochemistry. 2019 Oct 22;58(42):4284-4292. doi: 10.1021/acs.biochem.9b00665. Epub 2019 Oct 9. Biochemistry. 2019. PMID: 31545893 Free PMC article.
-
Population-based analysis of ocular Chlamydia trachomatis in trachoma-endemic West African communities identifies genomic markers of disease severity.Genome Med. 2018 Feb 26;10(1):15. doi: 10.1186/s13073-018-0521-x. Genome Med. 2018. PMID: 29482619 Free PMC article.
-
The Chlamydia trachomatis Plasmid and CT135 Virulence Factors Are Not Essential for Genital Tract Infection or Pathology in Female Pig-Tailed Macaques.Infect Immun. 2018 Apr 23;86(5):e00121-18. doi: 10.1128/IAI.00121-18. Print 2018 May. Infect Immun. 2018. PMID: 29463617 Free PMC article.
-
Transcriptional Expression of the ompA, cpaf, tarp, and tox Genes of Chlamydia trachomatis Clinical Isolates at Different Stages of the Developmental Cycle.Microorganisms. 2019 May 28;7(6):153. doi: 10.3390/microorganisms7060153. Microorganisms. 2019. PMID: 31141911 Free PMC article.
References
-
- Conrad TM, Joyce AR, Applebee MK, Barrett CL, Xie B, Gao Y, et al. Whole-genome resequencing of Escherichia coli K-12 MG1655 undergoing short-term laboratory evolution in lactate minimal media reveals flexible selection of adaptive mutations. Genome Biol. 2009; 10:R118 10.1186/gb-2009-10-10-r118 - DOI - PMC - PubMed
-
- Elena SF, Lenski RE. Evolution experiments with microorganisms: the dynamics and genetic bases of adaptation. Nat Rev Genet. 2003; 4:457–469. - PubMed
Publication types
MeSH terms
Substances
Grants and funding
LinkOut - more resources
Full Text Sources
Other Literature Sources
Molecular Biology Databases
Miscellaneous
