. 2015 Jul 24;10(7):e0133705.
doi: 10.1371/journal.pone.0133705. eCollection 2015.

A Genomic, Transcriptomic and Proteomic Look at the GE2270 Producer Planobispora rosea, an Uncommon Actinomycete

Affiliations

A Genomic, Transcriptomic and Proteomic Look at the GE2270 Producer Planobispora rosea, an Uncommon Actinomycete

Arianna Tocchetti et al. PLoS One. .

Abstract

We report the genome sequence of Planobispora rosea ATCC 53733, a mycelium-forming soil-dweller belonging to one of the lesser studied genera of Actinobacteria and producing the thiopeptide GE2270. The P. rosea genome presents considerable convergence in gene organization and function with other members in the family Streptosporangiaceae, with a significant number (44%) of shared orthologs. Patterns of gene expression in P. rosea cultures during exponential and stationary phase have been analyzed using whole transcriptome shotgun sequencing and by proteome analysis. Among the differentially abundant proteins, those involved in protein metabolism are particularly represented, including the GE2270-insensitive EF-Tu. Two proteins from the pbt cluster, directing GE2270 biosynthesis, slightly increase their abundance values over time. While GE2270 production starts during the exponential phase, most pbt genes, as analyzed by qRT-PCR, are down-regulated. The exception is represented by pbtA, encoding the precursor peptide of the ribosomally synthesized GE2270, whose expression reached the highest level at the entry into stationary phase.


Conflict of interest statement

Competing Interests: The authors have declared that no competing interests exist. This does not alter the authors' adherence to PLOS ONE policies on sharing data and materials.

Figures

Fig 1
Fig 1. Representation of the P. rosea genome.
Outer grey circle corresponds to the scaffolds and nucleotide length, with the replication origin (oriC) placed as nucleotide 1. Blue segments designate secondary metabolite clusters as reported in Table 2. The other circles denote the distribution of CDSs according to the functional categories of S1 Table (from edge to center): C to R, T and U. GC skew is represented by the inner circle.
Fig 2
Fig 2. Synteny of the P. rosea genome in comparison with S. roseum (panel A) and Microbispora sp. (panel B).
Dots represent reciprocal best hits obtained by pairwise BlastN searches. Numbers indicate genome coordinates in Mbp, with dnaA located at nucleotide 1 for each genome. The shaded box refers to the divergent segment in the P. rosea genome, where clusters 7 through 13 (Table 2) are located. The dashed vertical line denotes the position of the pbt cluster.
Fig 3
Fig 3. Shared CDSs among selected genomes.
The Venn diagrams represent the number of orthologs found in the P. rosea, S. roseum and Microbispora genomes (A) or in these three genomes and S. coelicolor (B). "STPG" refers to the orthologs shared by the three Streptosporangiaceae genomes; "ACTB" to the orthologs common also with S. coelicolor; and "PLBR" to the unique P. rosea genes.
Fig 4
Fig 4. P. rosea growth, glucose consumption and GE2270 production.
Flask cultivation of P. rosea was performed in V6 medium. Biomass accumulation was calculated from dry cell weight measurements, while GE2270A production was obtained after whole culture extraction. Each point represents the mean and standard deviation of three independent cultures. The arrows indicate the time points of sample collection for transcriptomic and proteomic analyses. See Materials and Methods for experimental details.
Fig 5
Fig 5. Abundance trends of ribosomal (A) and secondary metabolism (B) proteins.
Mean trend of each group is reported as red line and relative abundance of single protein species is showed as light blue line with the exception of abundance trends of ptb gene products which are reported as green line in panel B.
Fig 6
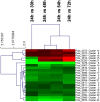
Fig 6. Trends of selected DEGs.
HeatMap representation of differentially expressed genes from Table 2 with p-value<0.05. Genes were hierarchically clustered at sample and gene level on the basis of Euclidean distances (left hand side of the figure). The correspondence of each gene to the clusters of Table 2 is also shown.
Fig 7
Fig 7. qRT-PCR of selected pbt genes.
The figure reports the relative FoldChange at 30, 48, 54 and 72 h (in order, left to right) relative to 24 h for each analyzed gene.

References

    1. Vobis G, Lodders N., Kämpfer P. Genus VII.Planobispora—The Actinobacteria, Part B In: Goodfellow M, Kämpfer P, Busse H-J, Trujillo ME, Suzuki KI, Ludwig W, et al., editors. Bergey's Manual of Systematic Bacteriology. 5 Second ed. New York: Springer; 2012. pp. 1861–6.
    1. Thiemann JE, Beretta G. A new genus of the Actinoplanaceae: Planobispora, gen. nov. Archiv fur Mikrobiologie. 1968;62: 157–66. Epub 1968/01/01. . - PubMed
    1. Goodfellow M, Stanton LJ, Simpson KE, Minnikin DE. Numerical and chemical classification of Actinoplanes and some related actinomycetes. Journal of General Microbiology. 1990;136: 19–36. 10.1099/00221287-136-1-19 - DOI
    1. Thiemann JE. Studies of Some new genera and species of the Actinoplanaceae In: H. P, editor. The Actinomycetales. Jena, Germany: Gustav Fischer Verlag; 1970. p. 245–57.
    1. Ngaemthao W, Suriyachadkun C, Chunhametha S, Tamura T, Sanglier JJ. Planobispora siamensis sp. nov., isolated from soil. Int J Syst Evol Microbiol. 2013;63: 2649–54. Epub 2013/01/08. 10.1099/ijs.0.046946-0 . - DOI - PubMed

Publication types

LinkOut - more resources