

Predicted Shifts in Small Mammal Distributions and Biodiversity in the Altered Future Environment of Alaska: An Open Access Data and Machine Learning Perspective
- PMID: 26207828
- PMCID: PMC4514745
- DOI: 10.1371/journal.pone.0132054
Predicted Shifts in Small Mammal Distributions and Biodiversity in the Altered Future Environment of Alaska: An Open Access Data and Machine Learning Perspective
Erratum in
-
Correction: Predicted Shifts in Small Mammal Distributions and Biodiversity in the Altered Future Environment of Alaska: An Open Access Data and Machine Learning Perspective.PLoS One. 2018 Mar 12;13(3):e0194377. doi: 10.1371/journal.pone.0194377. eCollection 2018. PLoS One. 2018. PMID: 29529081 Free PMC article.
Abstract
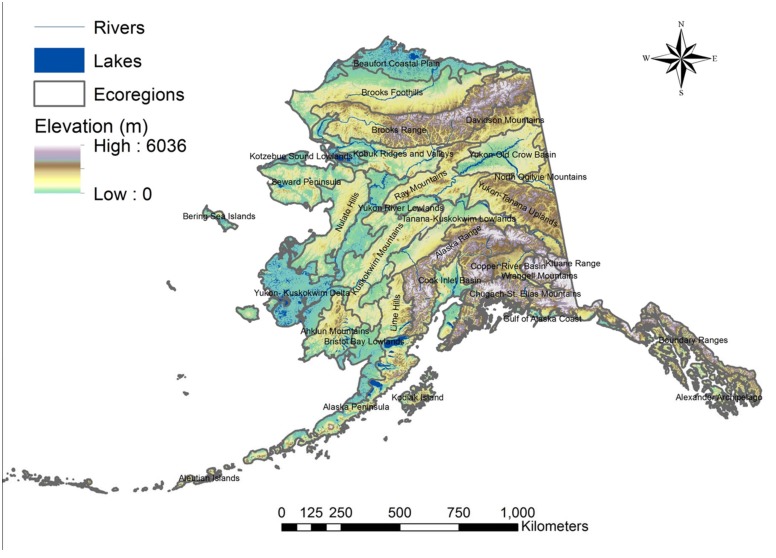
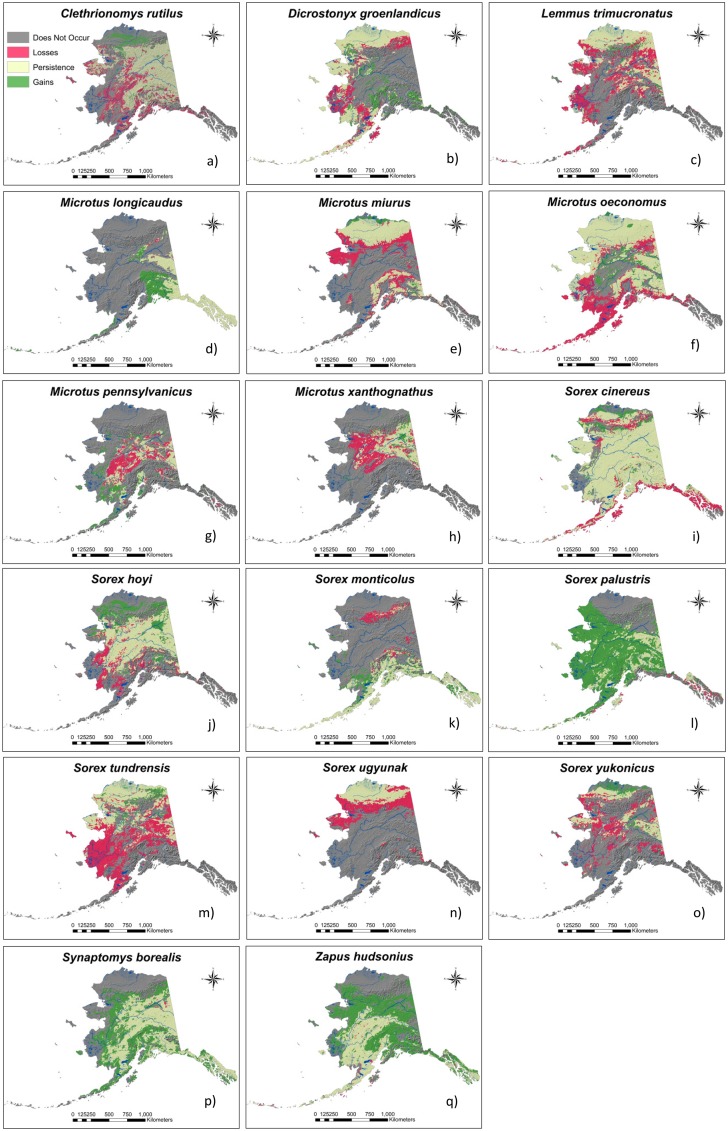
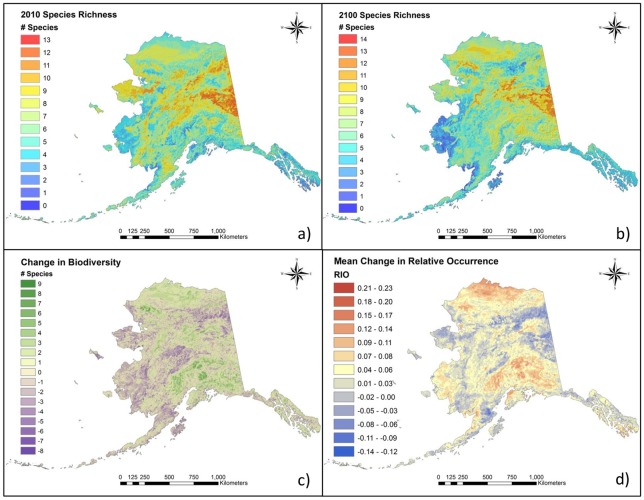
Climate change is acting to reallocate biomes, shift the distribution of species, and alter community assemblages in Alaska. Predictions regarding how these changes will affect the biodiversity and interspecific relationships of small mammals are necessary to pro-actively inform conservation planning. We used a set of online occurrence records and machine learning methods to create bioclimatic envelope models for 17 species of small mammals (rodents and shrews) across Alaska. Models formed the basis for sets of species-specific distribution maps for 2010 and were projected forward using the IPCC (Intergovernmental Panel on Climate Change) A2 scenario to predict distributions of the same species for 2100. We found that distributions of cold-climate, northern, and interior small mammal species experienced large decreases in area while shifting northward, upward in elevation, and inland across the state. In contrast, many southern and continental species expanded throughout Alaska, and also moved down-slope and toward the coast. Statewide community assemblages remained constant for 15 of the 17 species, but distributional shifts resulted in novel species assemblages in several regions. Overall biodiversity patterns were similar for both time frames, but followed general species distribution movement trends. Biodiversity losses occurred in the Yukon-Kuskokwim Delta and Seward Peninsula while the Beaufort Coastal Plain and western Brooks Range experienced modest gains in species richness as distributions shifted to form novel assemblages. Quantitative species distribution and biodiversity change projections should help land managers to develop adaptive strategies for conserving dispersal corridors, small mammal biodiversity, and ecosystem functionality into the future.
Conflict of interest statement
Figures


References
-
- Lovejoy TE and Hannah L (2005) Climate change and biodiversity. New Haven, Connecticut, USA: Yale University Press; 440 p.
-
- IPCC (2007) Climate Change 2007: The physical science basis Contribution of Working Group I to the Fourth Assessment Report of the Intergovernmental Panel on Climate Change. In: Solomon S., Qin D., Manning M., Chen Z., Marquis M., Avery K. B., Tignor M. and Miller H. L., editors. Cambridge, United Kingdom and New York, NY, USA: pp. 52.
-
- Lawler JJ, Shafer SL, White D, Kareiva P, Maurer EP, Blaustein AR, et al. (2009) Projected climate-induced faunal change in the Western Hemisphere. Ecology 90: 588–597. - PubMed
-
- Prost S, Guralnick RP, Waltari E, Federov VB, Kuzmina E, Smirnov N, et al. (2013) Losing ground: past history and future fate of Arctic small mammals in a changing climate. Global Change Biol 19: 1–11. - PubMed
-
- Vihma T (2014) Effects of Arctic Sea Ice Decline on Weather and Climate: A Review. Surveys in Geophysics 35: 1175–1214.
Publication types
MeSH terms
LinkOut - more resources
Full Text Sources
Other Literature Sources
