

Glioma Association and Balancing Selection of ZFPM2
- PMID: 26207917
- PMCID: PMC4514883
- DOI: 10.1371/journal.pone.0133003
Glioma Association and Balancing Selection of ZFPM2
Abstract
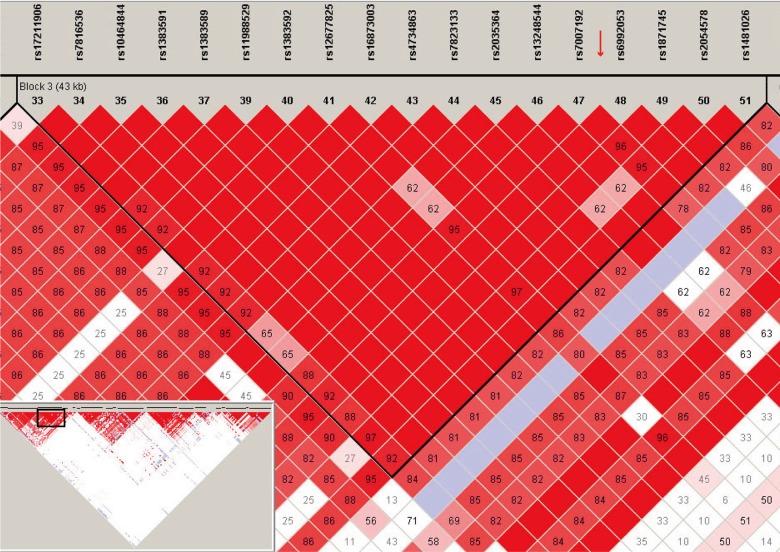
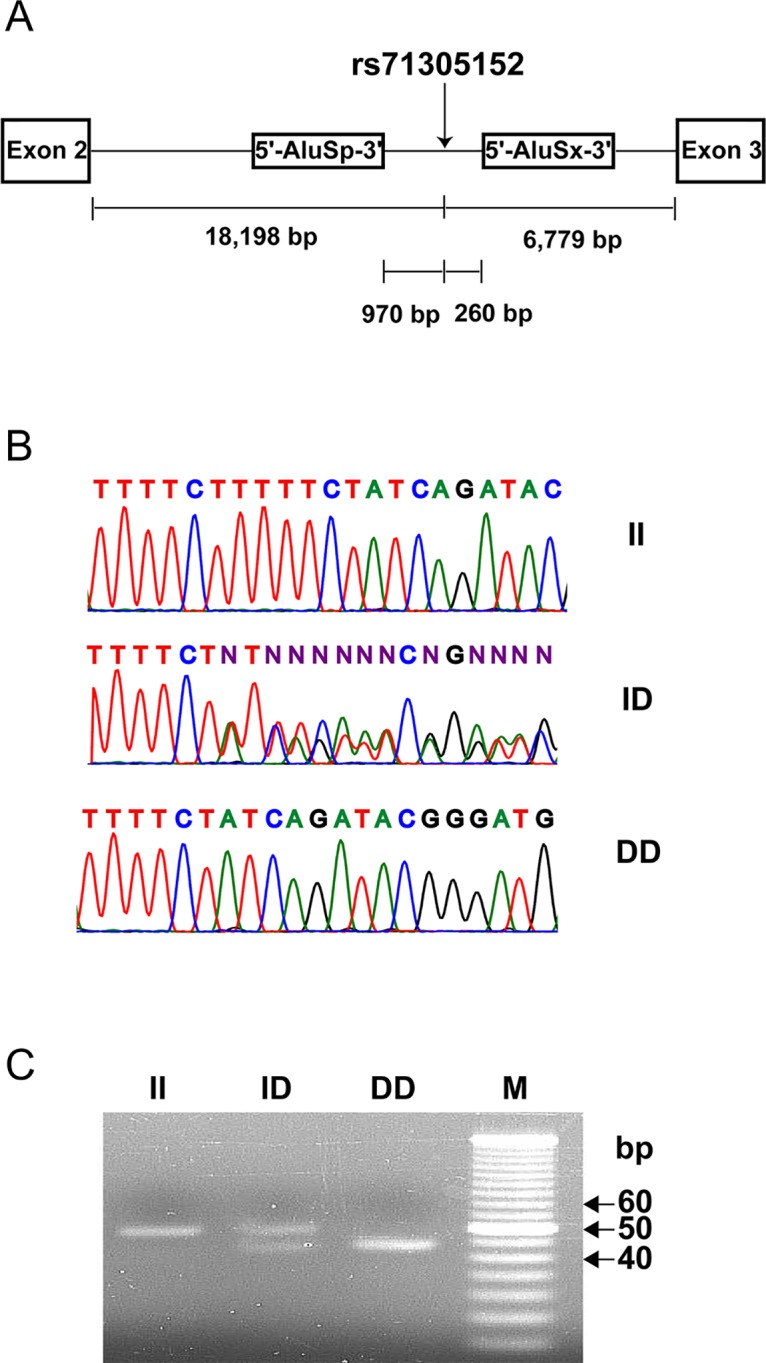
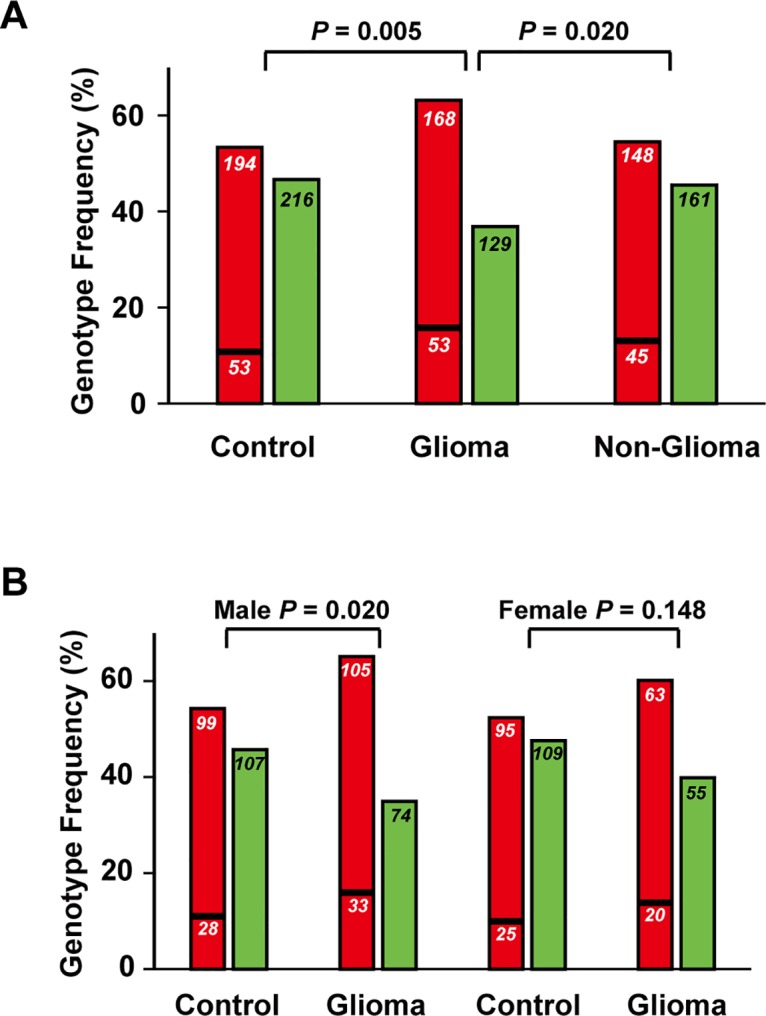
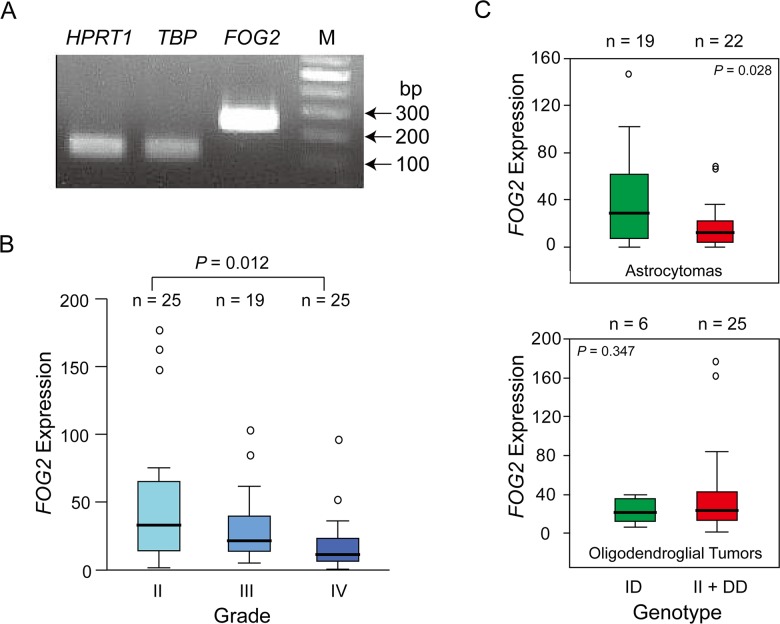
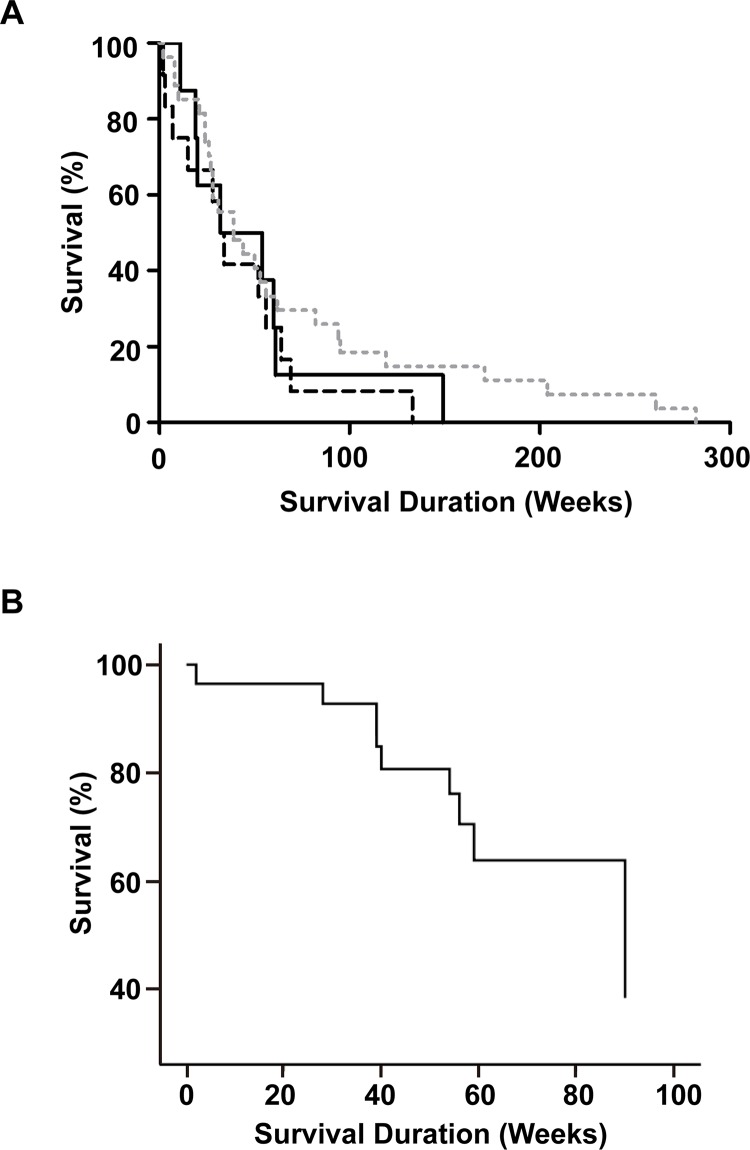
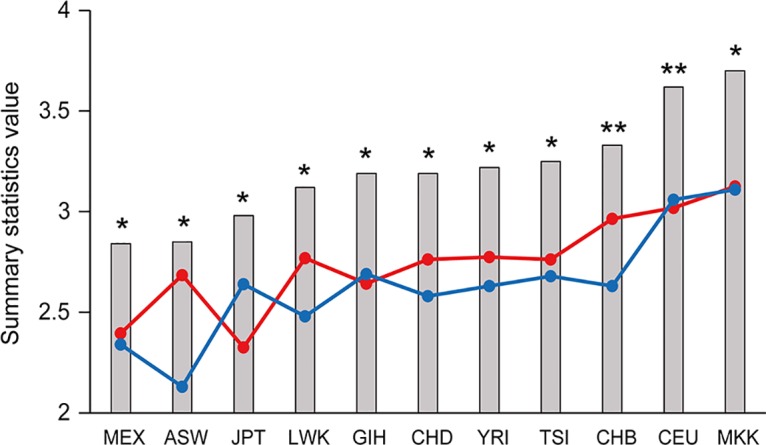
ZFPM2, encoding a zinc finger protein and abundantly expressed in the brain, uterus and smooth muscles, plays important roles in cardiac and gonadal development. Abnormal expression of ZFPM2 in ovarian tumors and neuroblastoma has been reported but hitherto its genetic association with cancer and effects on gliomas have not been studied. In the present study, the hexamer insertion-deletion polymorphism rs71305152, located within a large haplotype block spanning intron 1 to intron 3 of ZFPM2, was genotyped in Chinese cohorts of glioma (n = 350), non-glioma cancer (n = 354) and healthy control (n = 463) by direct sequencing and length polymorphism in gel electrophoresis, and ZFPM2 expression in glioma tissues (n = 69) of different grades was quantified by real-time RT-PCR. Moreover, potential natural selection pressure acting on the gene was investigated. Disease-association analysis showed that the overall genotype of rs71305152 was significantly associated with gliomas (P = 0.016), and the heterozygous genotype compared to the combined homozygous genotypes was less frequent in gliomas than in controls (P = 0.005) or non-glioma cancers (P = 0.020). ZFPM2 mRNA expression was negatively correlated with the grades of gliomas (P = 0.002), with higher expression levels in the low-grade gliomas. In the astrocytoma subtype, higher ZFPM2 expression was also correlated with the rs71305152 heterozygous genotype (P = 0.028). In addition, summary statistics tests gave highly positive values, demonstrating that the gene is under the influence of balancing selection. These findings suggest that ZFPM2 is a glioma susceptibility gene, its genotype and expression showing associations with incidence and severity, respectively. Moreover, the balancing selection acting on ZFPM2 may be related to the important roles it has to play in multiple organ development or associated disease etiology.
Conflict of interest statement
Figures
Similar articles
-
Association between genetic polymorphism of xrcc1 gene and risk of Glioma in ? Chinese population.Asian Pac J Cancer Prev. 2013;14(10):5957-60. doi: 10.7314/apjcp.2013.14.10.5957. Asian Pac J Cancer Prev. 2013. PMID: 24289608
-
Genetic polymorphisms in XRCC1 gene and susceptibility to glioma in Chinese Han population.Tumour Biol. 2014 Jan;35(1):357-62. doi: 10.1007/s13277-013-1050-2. Epub 2013 Aug 6. Tumour Biol. 2014. PMID: 23918303
-
HIF-1α genetic variants and protein expression confer the susceptibility and prognosis of gliomas.Neuromolecular Med. 2014 Sep;16(3):578-86. doi: 10.1007/s12017-014-8310-1. Epub 2014 Jun 15. Neuromolecular Med. 2014. PMID: 24929654
-
Association of genetic variants in the retinoblastoma binding protein 6 gene with the risk of glioma: a case-control study in a Chinese Han population.J Neurosurg. 2014 Nov;121(5):1209-18. doi: 10.3171/2014.6.JNS132240. Epub 2014 Aug 15. J Neurosurg. 2014. PMID: 25127414
-
Insight into the transcription factors regulating Ischemic stroke and glioma in response to shared stimuli.Semin Cancer Biol. 2023 Jul;92:102-127. doi: 10.1016/j.semcancer.2023.04.006. Epub 2023 Apr 11. Semin Cancer Biol. 2023. PMID: 37054904 Review.
Cited by
-
Network pharmacology of triptolide in cancer cells: implications for transcription factor binding.Invest New Drugs. 2021 Dec;39(6):1523-1537. doi: 10.1007/s10637-021-01137-y. Epub 2021 Jul 2. Invest New Drugs. 2021. PMID: 34213719 Free PMC article.
-
Bioinformatics analyses and biological function of lncRNA ZFPM2-AS1 and ZFPM2 gene in hepatocellular carcinoma.Oncol Lett. 2020 Jun;19(6):3677-3686. doi: 10.3892/ol.2020.11485. Epub 2020 Mar 27. Oncol Lett. 2020. PMID: 32382322 Free PMC article.
-
Multifaceted Role of PRDM Proteins in Human Cancer.Int J Mol Sci. 2020 Apr 10;21(7):2648. doi: 10.3390/ijms21072648. Int J Mol Sci. 2020. PMID: 32290321 Free PMC article. Review.
-
Survival stratification for colorectal cancer via multi-omics integration using an autoencoder-based model.Exp Biol Med (Maywood). 2022 Jun;247(11):898-909. doi: 10.1177/15353702211065010. Epub 2021 Dec 14. Exp Biol Med (Maywood). 2022. PMID: 34904882 Free PMC article.
References
-
- Finelli P, Pincelli AI, Russo S, Bonati MT, Recalcati MP, Masciadri M, et al. Disruption of friend of GATA 2 gene (FOG-2) by a de novo t(8;10) chromosomal translocation is associated with heart defects and gonadal dysgenesis. Clin Genet. 2007;71: 195–204. - PubMed
-
- Laitinen MP, Anttonen M, Ketola I, Wilson DB, Ritvos O, Butzow R, et al. Transcription factors GATA-4 and GATA-6 and a GATA family cofactor, FOG-2, are expressed in human ovary and sex cord-derived ovarian tumors. J Clin Endocrinol Metab. 2000;85: 3476–3483. - PubMed
Publication types
MeSH terms
Substances
LinkOut - more resources
Full Text Sources
Other Literature Sources
Medical
