

Vibrational Imaging of Glucose Uptake Activity in Live Cells and Tissues by Stimulated Raman Scattering
- PMID: 26207979
- PMCID: PMC4644272
- DOI: 10.1002/anie.201502543
Vibrational Imaging of Glucose Uptake Activity in Live Cells and Tissues by Stimulated Raman Scattering
Abstract
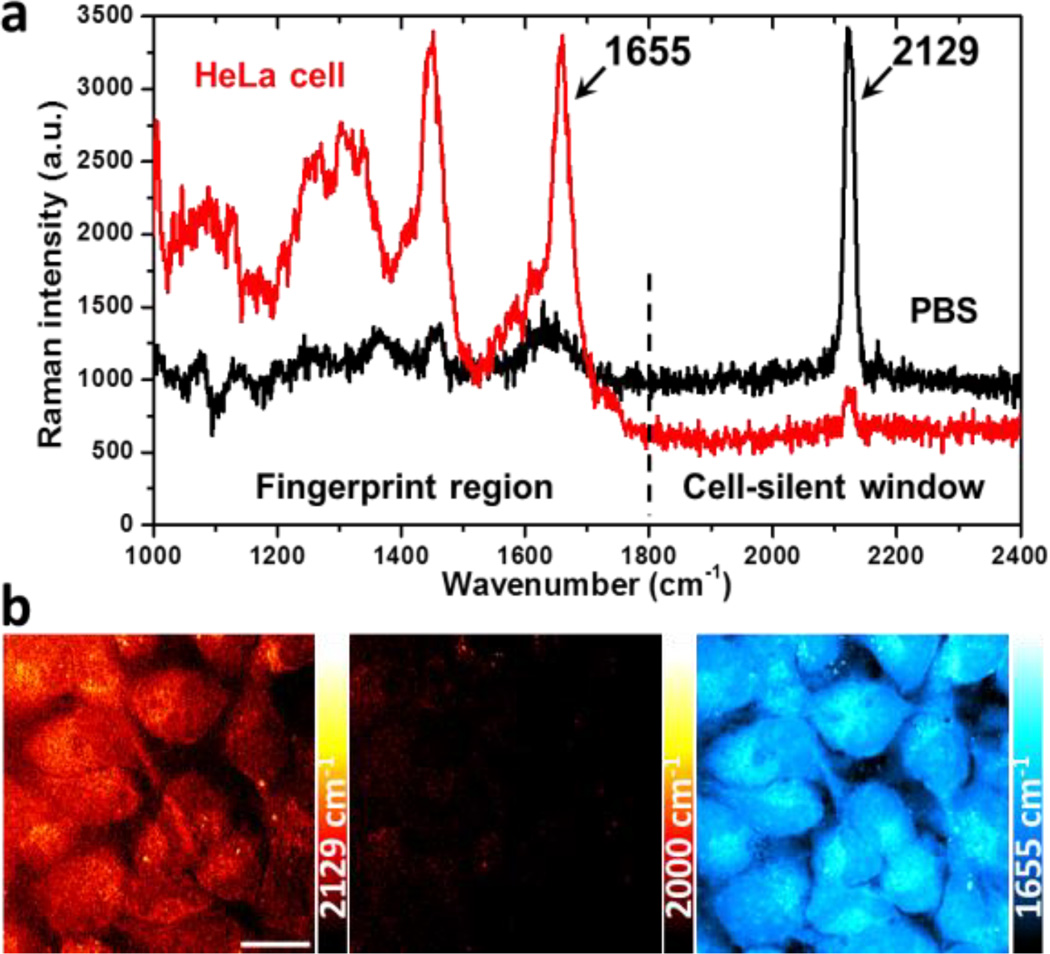
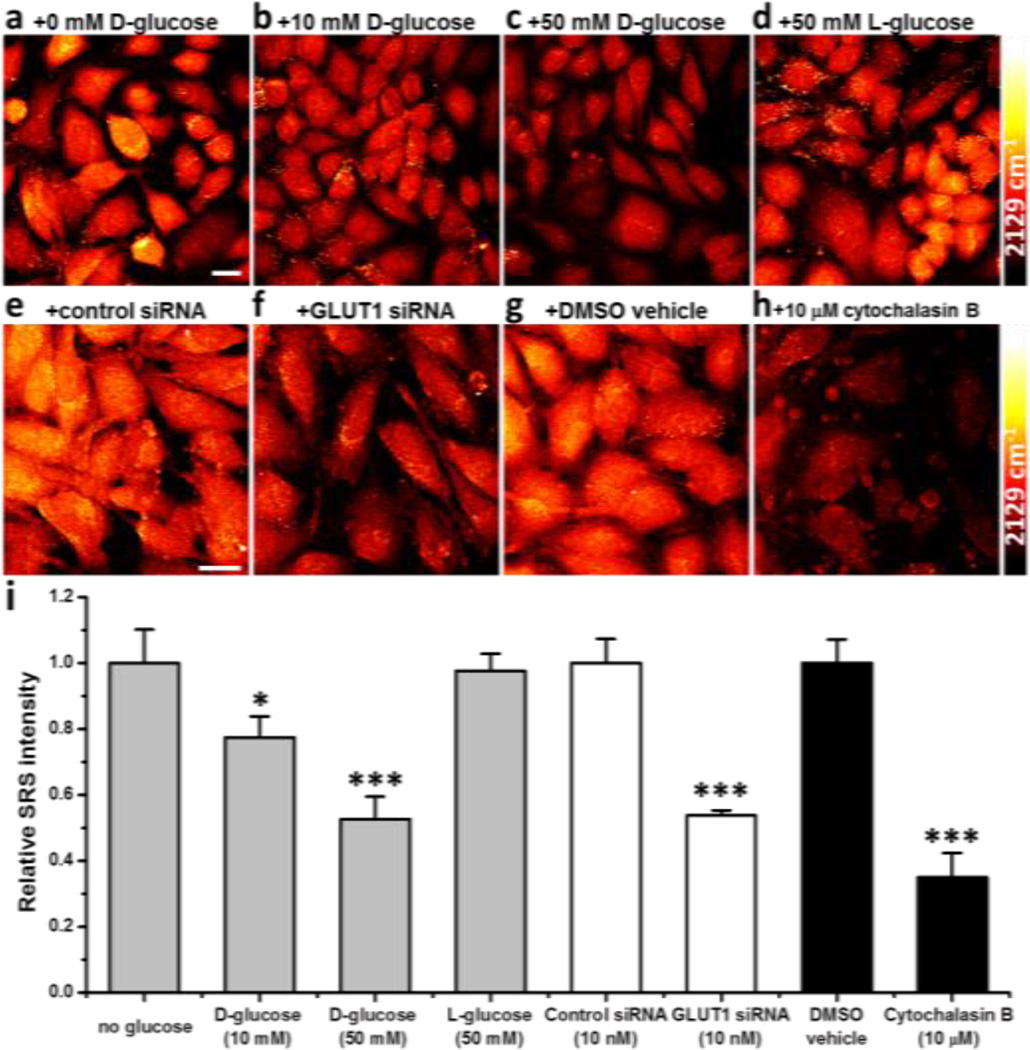
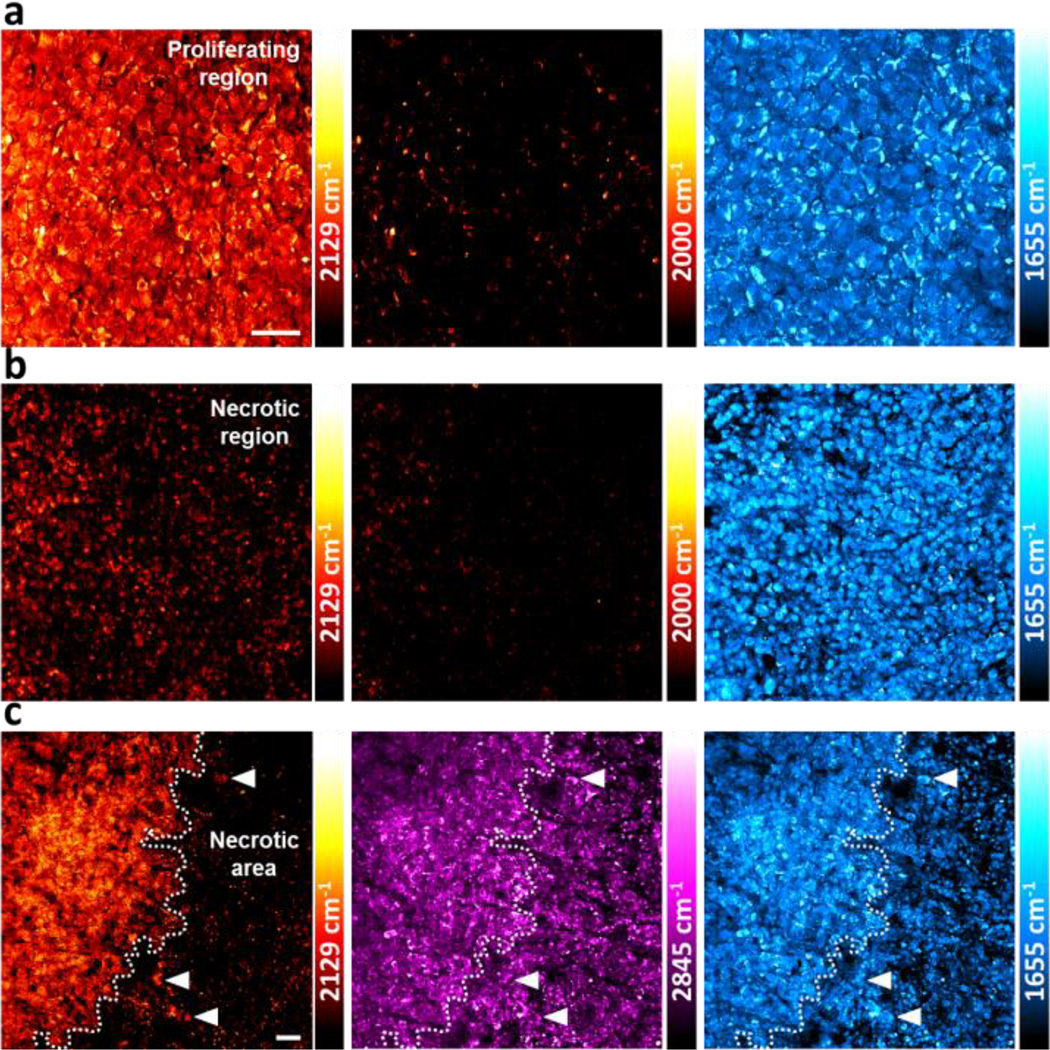
Glucose is a ubiquitous energy source for most living organisms. Its uptake activity closely reflects cellular metabolic demand in various physiopathological conditions. Extensive efforts have been made to specifically image glucose uptake, such as with positron emission tomography, magnetic resonance imaging, and fluorescence microscopy, but all have limitations. A new platform to visualize glucose uptake activity in live cells and tissues is presented that involves performing stimulated Raman scattering on a novel glucose analogue labeled with a small alkyne moiety. Cancer cells with differing metabolic activities can be distinguished. Heterogeneous uptake patterns are observed with clear cell-cell variations in tumor xenograft tissues, neuronal culture, and mouse brain tissues. By offering the distinct advantage of optical resolution but without the undesirable influence of fluorophores, this method will facilitate the study of energy demands of living systems with subcellular resolution.
Keywords: Raman spectroscopy; SRS microscopy; alkyne tags; glucose uptake; imaging agents.
© 2015 WILEY-VCH Verlag GmbH & Co. KGaA, Weinheim.
Figures


Similar articles
-
Live-Cell Bioorthogonal Chemical Imaging: Stimulated Raman Scattering Microscopy of Vibrational Probes.Acc Chem Res. 2016 Aug 16;49(8):1494-502. doi: 10.1021/acs.accounts.6b00210. Epub 2016 Aug 3. Acc Chem Res. 2016. PMID: 27486796 Free PMC article. Review.
-
Multicolor live-cell chemical imaging by isotopically edited alkyne vibrational palette.J Am Chem Soc. 2014 Jun 4;136(22):8027-33. doi: 10.1021/ja502706q. Epub 2014 May 21. J Am Chem Soc. 2014. PMID: 24849912 Free PMC article.
-
Imaging chemistry inside living cells by stimulated Raman scattering microscopy.Methods. 2017 Sep 1;128:119-128. doi: 10.1016/j.ymeth.2017.07.020. Epub 2017 Jul 23. Methods. 2017. PMID: 28746829 Review.
-
Label-free DNA imaging in vivo with stimulated Raman scattering microscopy.Proc Natl Acad Sci U S A. 2015 Sep 15;112(37):11624-9. doi: 10.1073/pnas.1515121112. Epub 2015 Aug 31. Proc Natl Acad Sci U S A. 2015. PMID: 26324899 Free PMC article.
-
Probing Methionine Uptake in Live Cells by Deuterium Labeling and Stimulated Raman Scattering.J Phys Chem B. 2022 Mar 3;126(8):1633-1639. doi: 10.1021/acs.jpcb.1c08343. Epub 2022 Feb 23. J Phys Chem B. 2022. PMID: 35195004
Cited by
-
Applications of vibrational tags in biological imaging by Raman microscopy.Analyst. 2017 Oct 23;142(21):4018-4029. doi: 10.1039/c7an01001j. Analyst. 2017. PMID: 28875184 Free PMC article. Review.
-
Physical bioenergetics: Energy fluxes, budgets, and constraints in cells.Proc Natl Acad Sci U S A. 2021 Jun 29;118(26):e2026786118. doi: 10.1073/pnas.2026786118. Proc Natl Acad Sci U S A. 2021. PMID: 34140336 Free PMC article.
-
Live Intracellular Biorthogonal Imaging by Surface Enhanced Raman Spectroscopy using Alkyne-Silver Nanoparticles Clusters.Sci Rep. 2018 Aug 23;8(1):12652. doi: 10.1038/s41598-018-31165-3. Sci Rep. 2018. PMID: 30140073 Free PMC article.
-
Structure-activity-distribution relationship study of anti-cancer antimycin-type depsipeptides.Chem Commun (Camb). 2019 Aug 1;55(63):9379-9382. doi: 10.1039/c9cc03051d. Chem Commun (Camb). 2019. PMID: 31317975 Free PMC article.
-
Bioorthogonal chemical imaging of metabolic activities in live mammalian hippocampal tissues with stimulated Raman scattering.Sci Rep. 2016 Dec 21;6:39660. doi: 10.1038/srep39660. Sci Rep. 2016. PMID: 28000773 Free PMC article.
References
-
- Plathow C, Weber WA. J. Nucl. Med. 2008;49:43S–63S. - PubMed
-
- Walker-Samuel S, Ramasawmy R, Torrealdea F, Rega M, Rajkumar V, Johnson SP, Richardson S, Goncalves M, Parkes HG, Arstad E, Thomas DL, Pedley RB, Lythgoe MF, Golay X. Nat. Med. 2013;19:1067–1072. - PMC - PubMed
- Rodrigues TB, Serrao EM, Kennedy BW, Hu DE, Kettunen MI, Brindle KM. Nat. Med. 2014;20:93–97. - PMC - PubMed
Publication types
MeSH terms
Substances
Grants and funding
LinkOut - more resources
Full Text Sources
Other Literature Sources
