

Assessment of mTOR-Dependent Translational Regulation of Interferon Stimulated Genes
- PMID: 26207988
- PMCID: PMC4514843
- DOI: 10.1371/journal.pone.0133482
Assessment of mTOR-Dependent Translational Regulation of Interferon Stimulated Genes
Abstract
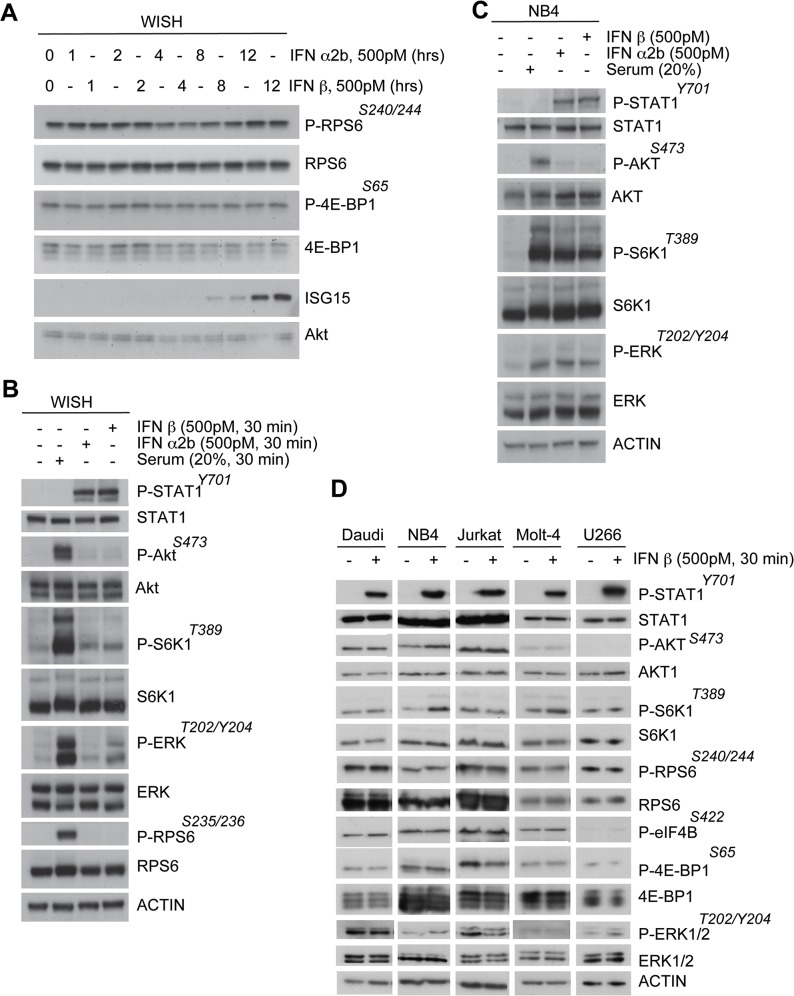
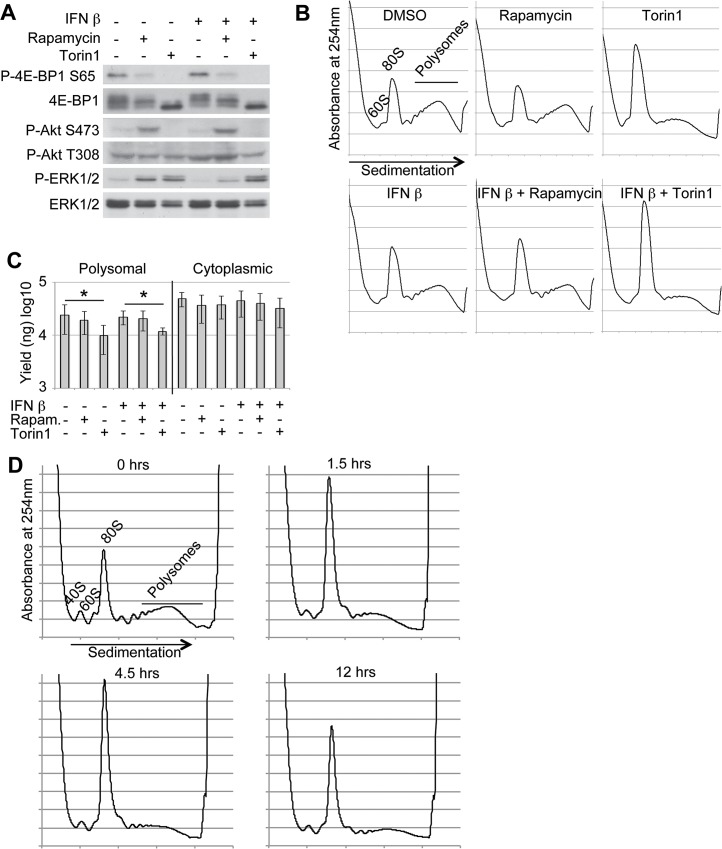
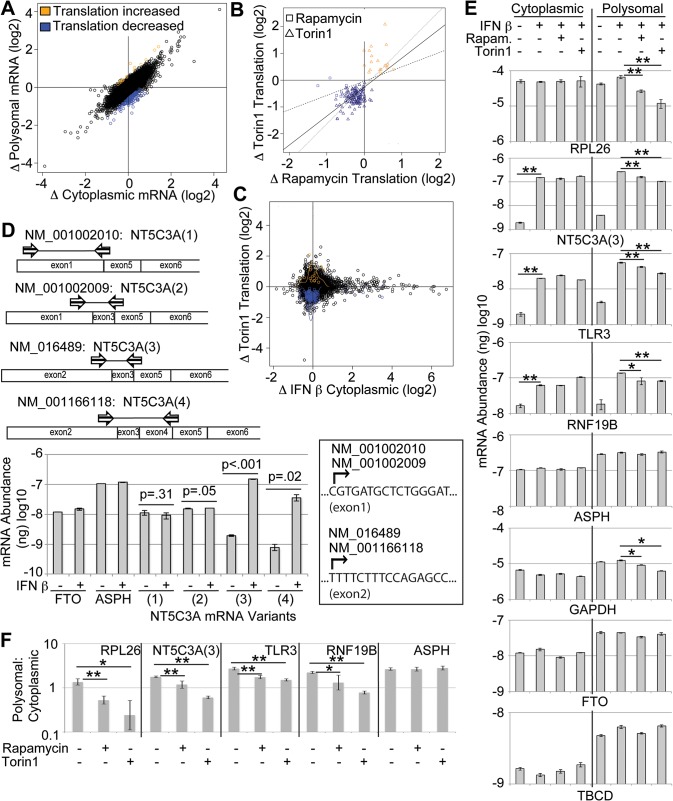
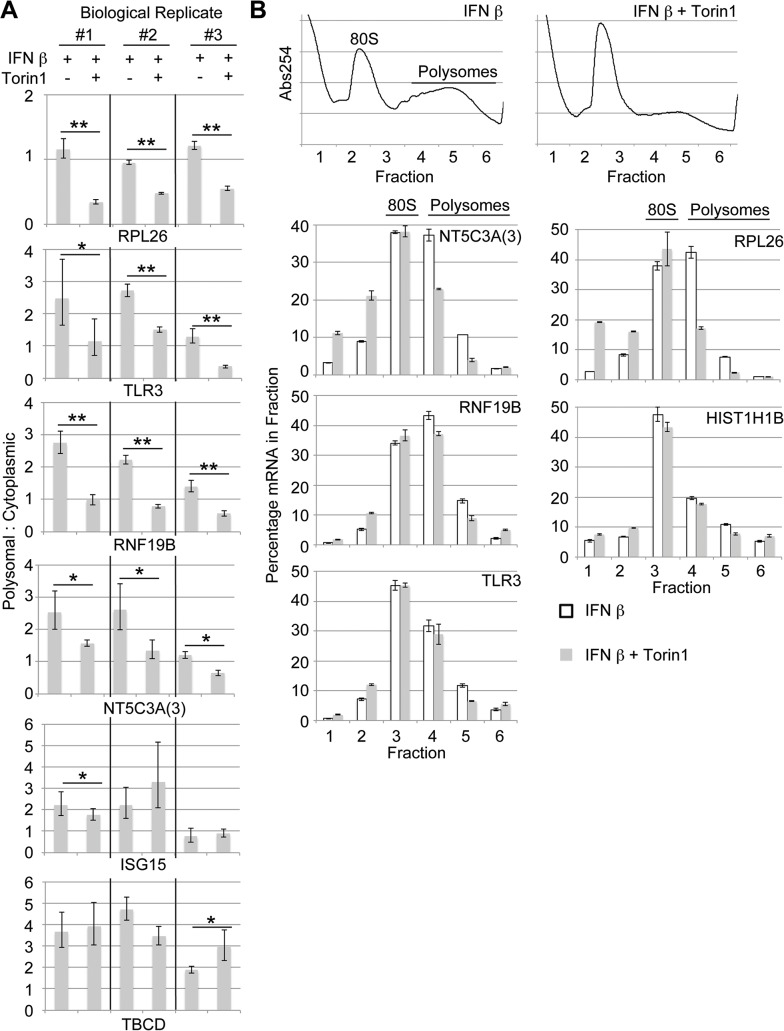
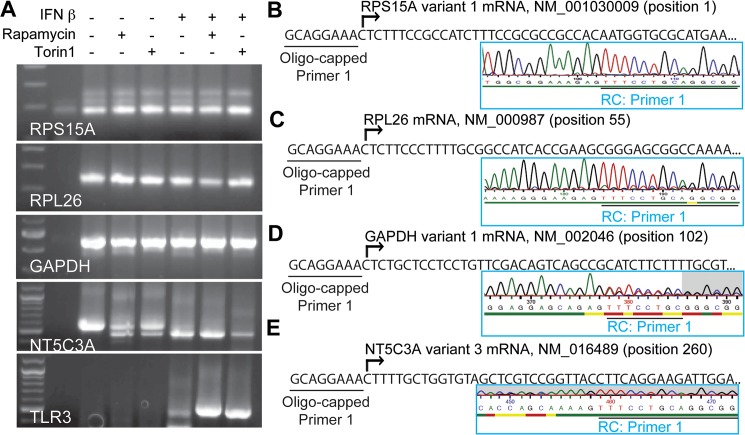
Type-I interferon (IFN)-induced activation of the mammalian target of rapamycin (mTOR) signaling pathway has been implicated in translational control of mRNAs encoding interferon-stimulated genes (ISGs). However, mTOR-sensitive translatomes commonly include mRNAs with a 5' terminal oligopyrimidine tract (TOP), such as those encoding ribosomal proteins, but not ISGs. Because these translatomes were obtained under conditions when ISG expression is not induced, we examined the mTOR-sensitive translatome in human WISH cells stimulated with IFN β. The mTOR inhibitor Torin1 resulted in a repression of global protein synthesis, including that of ISG products, and translation of all but 3 ISG mRNAs (TLR3, NT5C3A, and RNF19B) was not selectively more sensitive to mTOR inhibition. Detailed studies of NT5C3A revealed an IFN-induced change in transcription start site resulting in a switch from a non-TOP to a TOP-like transcript variant and mTOR sensitive translation. Thus, we show that, in the cell model used, translation of the vast majority of ISG mRNAs is not selectively sensitive to mTOR activity and describe an uncharacterized mechanism wherein the 5'-UTR of an mRNA is altered in response to a cytokine, resulting in a shift from mTOR-insensitive to mTOR-sensitive translation.
Conflict of interest statement
Figures
Similar articles
-
mTOR-sensitive translation: Cleared fog reveals more trees.RNA Biol. 2017 Oct 3;14(10):1299-1305. doi: 10.1080/15476286.2017.1290041. Epub 2017 Feb 10. RNA Biol. 2017. PMID: 28277937 Free PMC article. Review.
-
nanoCAGE reveals 5' UTR features that define specific modes of translation of functionally related MTOR-sensitive mRNAs.Genome Res. 2016 May;26(5):636-48. doi: 10.1101/gr.197566.115. Epub 2016 Mar 16. Genome Res. 2016. PMID: 26984228 Free PMC article.
-
Translation of Human β-Actin mRNA is Regulated by mTOR Pathway.Genes (Basel). 2019 Jan 29;10(2):96. doi: 10.3390/genes10020096. Genes (Basel). 2019. PMID: 30700035 Free PMC article.
-
Stable isotope-labelling analysis of the impact of inhibition of the mammalian target of rapamycin on protein synthesis.Biochem J. 2012 May 15;444(1):141-51. doi: 10.1042/BJ20112107. Biochem J. 2012. PMID: 22428559
-
The ever-evolving role of mTOR in translation.Semin Cell Dev Biol. 2014 Dec;36:102-12. doi: 10.1016/j.semcdb.2014.09.014. Epub 2014 Sep 27. Semin Cell Dev Biol. 2014. PMID: 25263010 Review.
Cited by
-
mTOR-sensitive translation: Cleared fog reveals more trees.RNA Biol. 2017 Oct 3;14(10):1299-1305. doi: 10.1080/15476286.2017.1290041. Epub 2017 Feb 10. RNA Biol. 2017. PMID: 28277937 Free PMC article. Review.
-
Inhibiting the P2Y12 Receptor in Megakaryocytes and Platelets Suppresses Interferon-Associated Responses.JACC Basic Transl Sci. 2024 Jul 24;9(9):1126-1140. doi: 10.1016/j.jacbts.2024.05.014. eCollection 2024 Sep. JACC Basic Transl Sci. 2024. PMID: 39444926 Free PMC article.
-
Mice deficient in NKLAM have attenuated inflammatory cytokine production in a Sendai virus pneumonia model.PLoS One. 2019 Sep 20;14(9):e0222802. doi: 10.1371/journal.pone.0222802. eCollection 2019. PLoS One. 2019. PMID: 31539400 Free PMC article.
-
Iminosugars With Endoplasmic Reticulum α-Glucosidase Inhibitor Activity Inhibit ZIKV Replication and Reverse Cytopathogenicity in vitro.Front Microbiol. 2020 Apr 7;11:531. doi: 10.3389/fmicb.2020.00531. eCollection 2020. Front Microbiol. 2020. PMID: 32373079 Free PMC article.
-
Genome-wide assessment of differential translations with ribosome profiling data.Nat Commun. 2016 Apr 4;7:11194. doi: 10.1038/ncomms11194. Nat Commun. 2016. PMID: 27041671 Free PMC article.
References
-
- Borden EC, Williams BR (2011) Interferon-stimulated genes and their protein products: what and how? J Interferon Cytokine Research 31: 1–4. - PubMed
-
- Deb DK, Sassano A, Lekmine F, Majchrzak B, Verma A, Kambhampati S, et al. (2003) Activation of protein kinase C delta by IFN-gamma. J Immunol 171: 267–273. - PubMed
Publication types
MeSH terms
Substances
Associated data
- Actions
LinkOut - more resources
Full Text Sources
Other Literature Sources
Molecular Biology Databases
Miscellaneous
