. 2015 Jul 24;10(7):e0133533.
doi: 10.1371/journal.pone.0133533. eCollection 2015.

Evaluation of Cross-Protocol Stability of a Fully Automated Brain Multi-Atlas Parcellation Tool

Affiliations

Evaluation of Cross-Protocol Stability of a Fully Automated Brain Multi-Atlas Parcellation Tool

Zifei Liang et al. PLoS One. .

Abstract

Brain parcellation tools based on multiple-atlas algorithms have recently emerged as a promising method with which to accurately define brain structures. When dealing with data from various sources, it is crucial that these tools are robust for many different imaging protocols. In this study, we tested the robustness of a multiple-atlas, likelihood fusion algorithm using Alzheimer's Disease Neuroimaging Initiative (ADNI) data with six different protocols, comprising three manufacturers and two magnetic field strengths. The entire brain was parceled into five different levels of granularity. In each level, which defines a set of brain structures, ranging from eight to 286 regions, we evaluated the variability of brain volumes related to the protocol, age, and diagnosis (healthy or Alzheimer's disease). Our results indicated that, with proper pre-processing steps, the impact of different protocols is minor compared to biological effects, such as age and pathology. A precise knowledge of the sources of data variation enables sufficient statistical power and ensures the reliability of an anatomical analysis when using this automated brain parcellation tool on datasets from various imaging protocols, such as clinical databases.


Conflict of interest statement

Competing Interests: Co-authors SM and MIM have the following patents US 12/743,169 ("Automate Image Analyses for Magnetic Resonance Imaging"), US 2/747,816 ("Advanced Cost Functions for Image Registration for Automated Image Analysis"), 61/ 357,361 ("Atlas-based Analysis for Image-based Anatomic and Functional Data of Organisms") all licensed to natomyWorks, which they own (arrangement managed by Johns Hopkins University in accordance with its conflict of interest policies). There are no further patents, products in development or marketed products to declare. This does not alter the authors' adherence to all the PLOS ONE policies on sharing data and materials.

Figures

Fig 1
Fig 1. Brain parcellation scheme of the JHU multiple atlases.
Multiple granularity levels (L1 to L5) are shown. Level 5 (L5) has the highest granularity and defines 286 regions. An anatomy-based hierarchical relationship was established to generate super-structures and lower-granularity parcellation, as shown in L1–L4.
Fig 2
Fig 2. Distribution of Bonferroni-corrected p-values for protocol differences in 286 structures at Level 5.
For better visualization, the p-values (P, y-axis) are presented as Log10(P/5). A p-value of 0.05 corresponds to -2 on the y-axis. At this threshold, two regions reached statistical significance.
Fig 3
Fig 3. Regional volumes affected by the differences in protocol.
The volumes are normalized by the “total brain” volume (parenchyma plus CSF). Two regions (left inferior temporal gyrus [ITWM_L] and the right rectus gyrus [RGWM_R] white matter) showed significantly smaller volumes on the GE scanners.
Fig 4
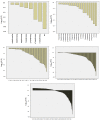
Fig 4. Distribution of Bonferroni-corrected p-values from the correlation between age and regional volumes.
All the granularity levels are shown. For better visualization, the P values are presented as Log10(P/5). Therefore, p<0.05 corresponds to <-2 on the y-axis.
Fig 5
Fig 5. Examples of significant correlations between regional volumes and age at granularity level 1.
The colors code the correlation coefficient R in regions where the age vs. volume curve achieves significance (p-value <0.05, Bonferroni-corrected). Yellow / orange / red (R<0) are regions that shrink over time, while blue (R>0) are regions that expand over time, such as ventricles. As is shown in the figure: a. telencephalon (right); b. diencephalon (left); c. telencephalon (left); d. diencephalon (right); e. cerebrospinal fluid.
Fig 6
Fig 6. Examples of significant correlations between regional volumes and age at granularity level 2.
The colors code the correlation coefficient R in regions where the age vs. volume curve achieves significance (p-value <0.05, Bonferroni-corrected). Yellow / orange / red (R<0) are regions that shrink over time, while blue (R>0) are regions that expand over time, such as ventricles. As is shown in the figure: a. cerebral cortex (left); b. white matter (left); c. ventricle; d. thalamus (left); e. sulcus (left).
Fig 7
Fig 7. Examples of significant correlations between regional volumes and age at granularity level 3.
The colors code the correlation coefficient R in regions where the age vs. volume curve achieves significance (p-value <0.05, Bonferroni-corrected). Yellow / orange / red (R<0) are regions that shrink over time, while blue (R>0) are regions that expand over time, such as ventricles. As is shown in the figure: a. sulci of the temporal lobe (left); b. temporal lobe (left); c. sulci of the parietal lobe (left); d. anterior part of the white matter (left); e.sulci of the occipital lobe (left); f. sulci of the cingulate gyrus (left).
Fig 8
Fig 8. Examples of significant correlations between regional volumes and age at granularity level 4.
The colors code the correlation coefficient R in regions where the age vs. volume curve achieves significance (p-value <0.05, Bonferroni-corrected). Yellow / orange / red (R<0) are regions that shrink over time, while blue (R>0) are regions that expand over time, such as ventricles. As is shown in the figure: a. anterior part of the deep and periventricular white matter (left); b. Sylvian fissure and posterior insular sulcus (left); c. central sulcus (left); d. posterior limb of the internal capsule (left); e. Inferior part of the lateral ventricle (left); f. subcortical white matter of the cingulate gyrus (left).
Fig 9
Fig 9. Examples of significant correlations between regional volumes and age at granularity level 5.
The colors code the correlation coefficient R in regions where the age vs. volume curve achieves significance (p-value <0.05, Bonferroni-corrected). Yellow / orange / red (R<0) are regions that shrink over time, while blue (R>0) are regions that expand over time, such as ventricles. As is shown in the figure: a. gryus rectus (left); b. subcortical white matter of the superior temporal gyrus (right); c. anterior corona radiata (left); d. inferior horn of the lateral ventricle (left); e. frontal horn of the lateral ventricle (left); superior corona radiata (left).
Fig 10
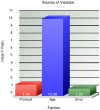
Fig 10. Source of variation in normalized regional volumes at level 5.
More than 10% of variance is explained by age, 1.54% is explained by the protocols, and 1% is attributed to error.
Fig 11
Fig 11. Differences in regional volumes between AD and controls at each granularity level.
The colors code the ratio of volumes in AD/controls in regions of significant difference (P value<0.05, Bonferroni-corrected). Blue (ratio <1) represents regions of atrophy in AD, while green/yellow/red are regions that are bigger in AD, such as the ventricles.

References

    1. Frisoni GB, Fox NC, Jack CR Jr., Scheltens P, Thompson PM (2010) The clinical use of structural MRI in Alzheimer disease. Nat Rev Neurol 6: 67–77. 10.1038/nrneurol.2009.215 - DOI - PMC - PubMed
    1. Johnson KA, Fox NC, Sperling RA, Klunk WE (2012) Brain imaging in Alzheimer disease. Cold Spring Harb Perspect Med 2: a006213 10.1101/cshperspect.a006213 - DOI - PMC - PubMed
    1. Merlo Pich E, Jeromin A, Frisoni GB, Hill D, Lockhart A, Schmidt ME, et al. (2014) Imaging as a biomarker in drug discovery for Alzheimer's disease: is MRI a suitable technology? Alzheimers Res Ther 6: 51 10.1186/alzrt276 - DOI - PMC - PubMed
    1. Ashburner J, Friston KJ (2000) Voxel-based morphometry—the methods. Neuroimage 11: 805–821. - PubMed
    1. Kloppel S, Stonnington CM, Chu C, Draganski B, Scahill RI, Rohrer JD, et al. (2008) Automatic classification of MR scans in Alzheimer's disease. Brain 131: 681–689. 10.1093/brain/awm319 - DOI - PMC - PubMed

Publication types

LinkOut - more resources