. 2015 Jul 24:4:e08298.
doi: 10.7554/eLife.08298.

Starvation promotes concerted modulation of appetitive olfactory behavior via parallel neuromodulatory circuits

Affiliations

Starvation promotes concerted modulation of appetitive olfactory behavior via parallel neuromodulatory circuits

Kang I Ko et al. Elife. .

Abstract

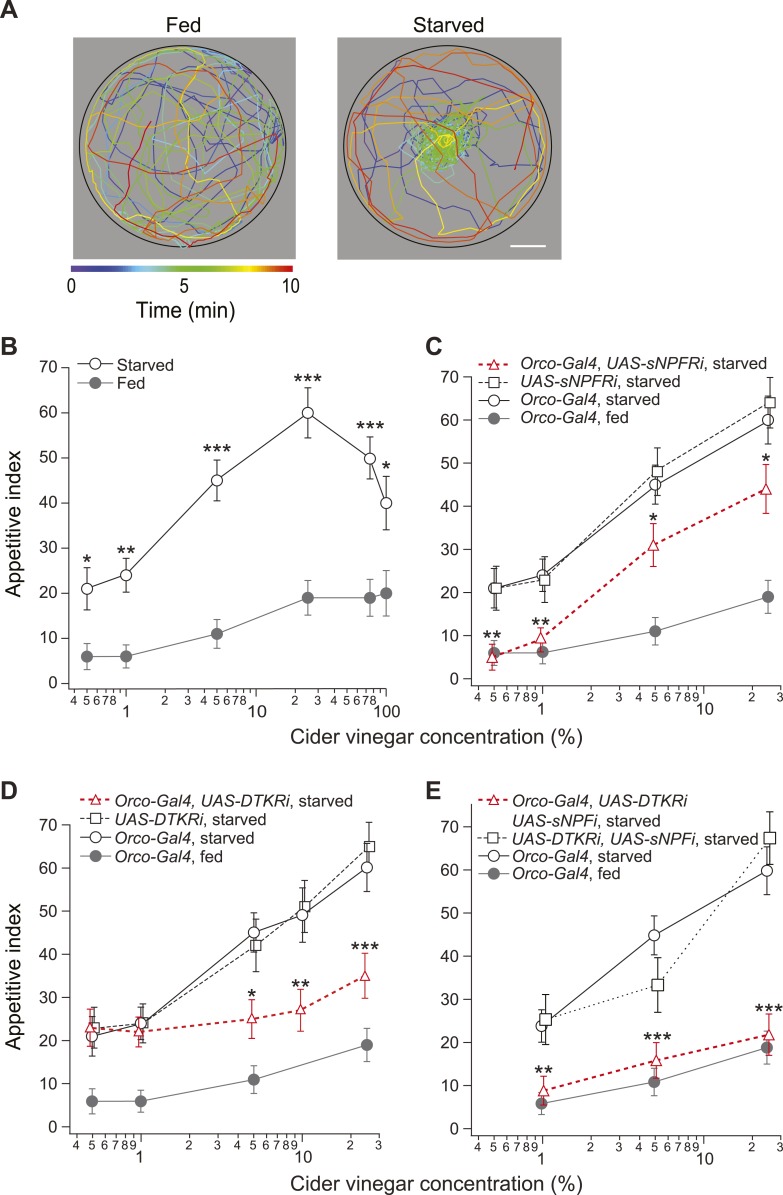
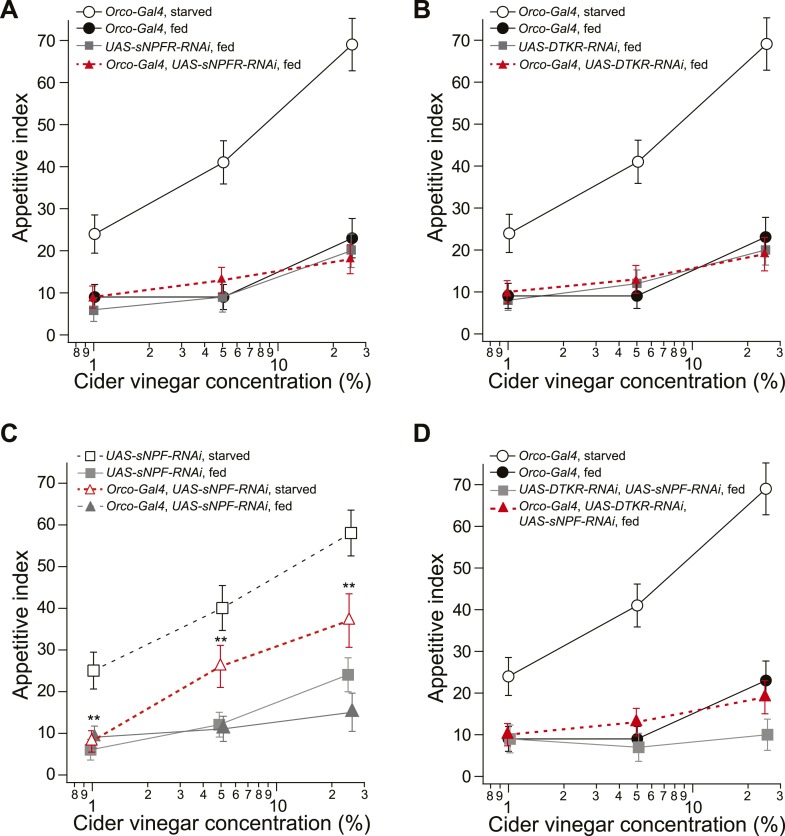
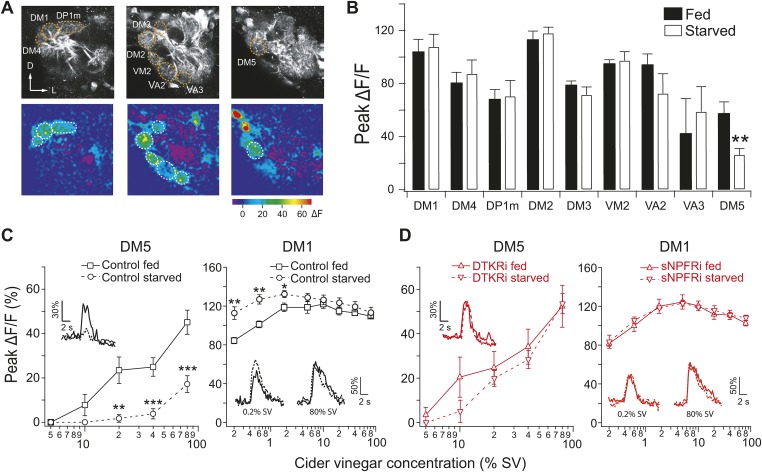
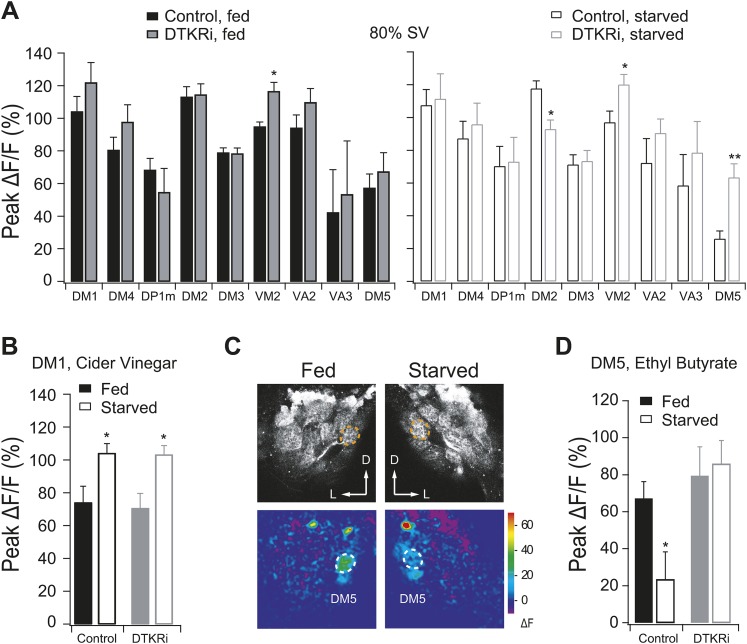
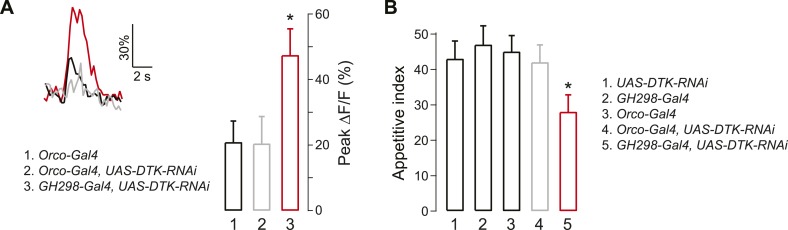
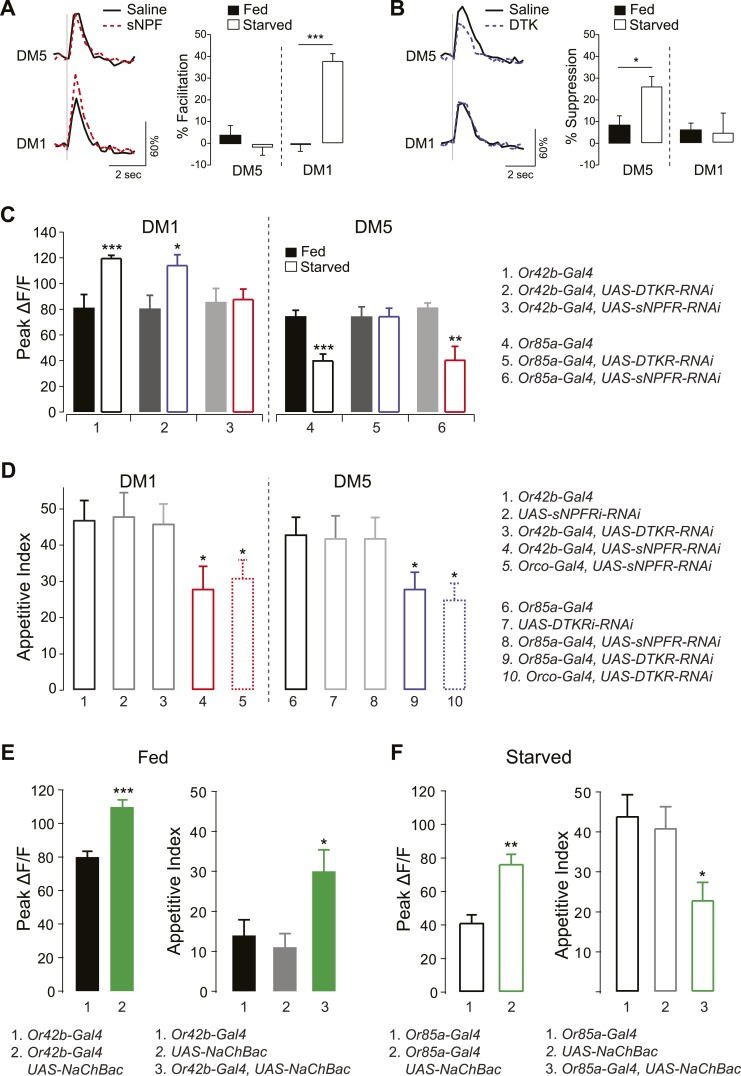
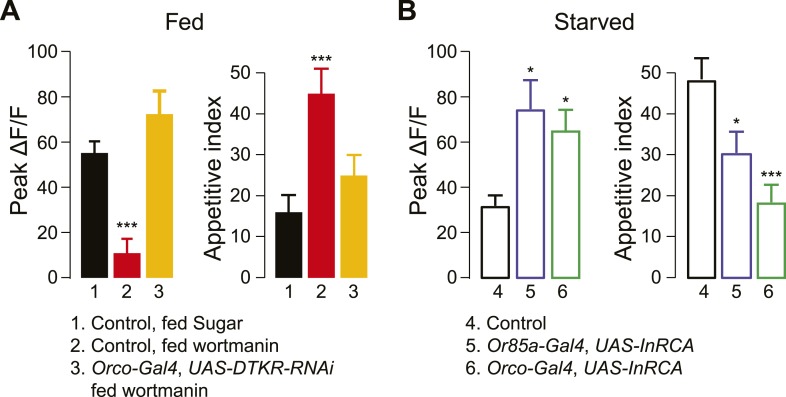
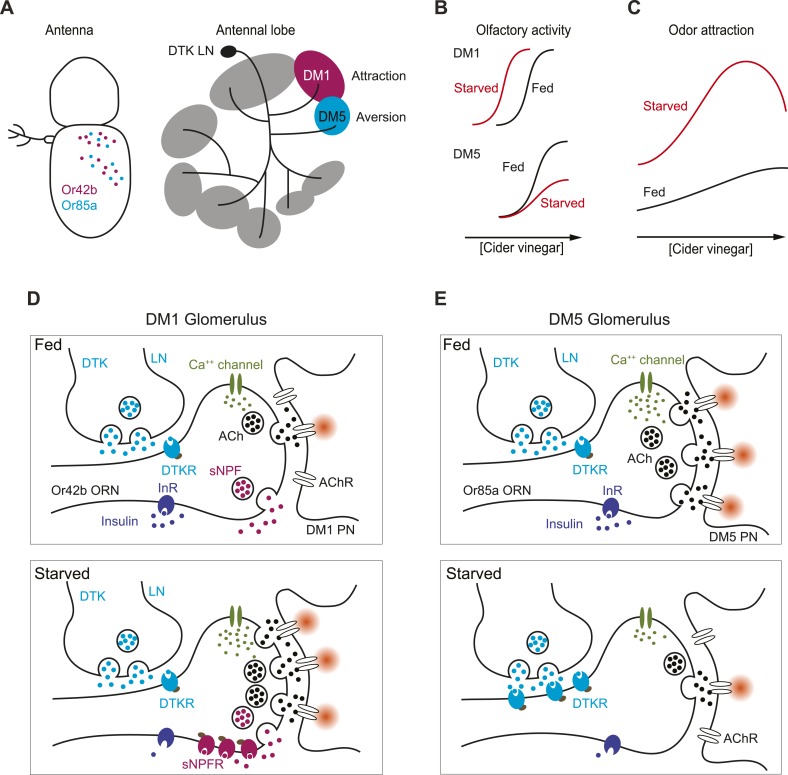
The internal state of an organism influences its perception of attractive or aversive stimuli and thus promotes adaptive behaviors that increase its likelihood of survival. The mechanisms underlying these perceptual shifts are critical to our understanding of how neural circuits support animal cognition and behavior. Starved flies exhibit enhanced sensitivity to attractive odors and reduced sensitivity to aversive odors. Here, we show that a functional remodeling of the olfactory map is mediated by two parallel neuromodulatory systems that act in opposing directions on olfactory attraction and aversion at the level of the first synapse. Short neuropeptide F sensitizes an antennal lobe glomerulus wired for attraction, while tachykinin (DTK) suppresses activity of a glomerulus wired for aversion. Thus we show parallel neuromodulatory systems functionally reconfigure early olfactory processing to optimize detection of nutrients at the risk of ignoring potentially toxic food resources.

Keywords: D. melanogaster; RNA-seq; insulin; neuroscience; olfaction; sNPF; substance P; two-photon imaging.


Conflict of interest statement

The authors declare that no competing interests exist.

Figures

Figure 1.
Figure 1.. Starvation state fine-tunes appetitive behavior.
(A) A single fly assay was used to measure food search behavior. The coordinates of representative fed (left) and starved (right) flies show their positions during a 10-min period in response to 5% cider vinegar. Scale bar: 10 mm. (B) The appetitive index of fed and starved Orco-Gal4 control flies at varying concentrations. (CE) The appetitive index of receptor knockdown flies, in which the receptor RNAi is expressed in the Orco odorant receptor neurons (ORNs). (C) Short neuropeptide F receptor (sNPFR) knockdown flies. (D) Drosophila tachykinin receptor (DTKR) knockdown flies. (E) sNPF and DTKR dual knockdown flies. (BE) n = 63–129 for each condition. Error bars show s.e.m. *p < 0.05, **p < 0.01, ***p < 0.001; z-test for proportions comparing between starved and fed (B), and comparing knockdown flies to the Orco-Gal4 and UAS- control group in the starvation state (C, D, E). DOI: http://dx.doi.org/10.7554/eLife.08298.003
Figure 1—figure supplement 1.
Figure 1—figure supplement 1.. Food search behavior in control and knockdown flies.
(A) The appetitive index of fed control and sNPFR knockdown flies compared to a starved Orco-Gal4 control. n = 60–124 for each condition. (B) The appetitive index of the fed control and DTKR knockdown flies compared to a starved Orco-Gal4 control. n = 55–122 for each condition. (C) The appetitive index of control and sNPF knockdown flies in the fed and starved state. n = 76–118 for each condition. (D) The appetitive index of the fed control and sNPF-DTKR double knockdown flies compared to a starved Orco-Gal4 control. n = 56–127 for each condition. Error bars show s.e.m. **p < 0.01; z-test for proportions comparing knockdown flies to the fed control groups (A, B, D), and comparing knockdown flies to the starved control group (C). DOI: http://dx.doi.org/10.7554/eLife.08298.004
Figure 2.
Figure 2.. Starvation-dependent neuropeptide signaling modulates sensitivity of the DM1 and DM5 glomeruli.
(A) Representative two photon images of projection neuron (PN) dendritic calcium responses to 80% saturated vapor (SV) of apple cider vinegar in starved DTKR knockdown flies. Grey-scale images show the glomerular map on three optical planes whereas the pseudocolored images show the change of fluorescence. (B) Peak ΔF/F in glomeruli that are activated by 80% SV cider vinegar in fed and starved flies. (C, D) Responses in the DM1 and DM5 glomeruli at varying concentrations in fed and starved control flies (C) and in flies that express DTKR-RNAi or sNPFR-RNAi in ORNs labeled by Orco-Gal4 (D). Calcium signals for PN responses were imaged using GH146-LexA, LexAop-GCaMP flies in addition to the indicated transgenes. n = 5–7 for each. Error bars show s.e.m. *p < 0.05, **p < 0.01, ***p < 0.001; Student's t-test comparing between starved and fed responses. DOI: http://dx.doi.org/10.7554/eLife.08298.006
Figure 2—figure supplement 1.
Figure 2—figure supplement 1.. PN responses to vinegar in flies with DTKR knockdown.
Two-photon imaging of PN dendritic calcium responses. (A) Peak ΔF/F in glomeruli that are activated by 80% SV cider vinegar in control and DTKR knockdown flies. (B) Peak ΔF/F in the DM1 glomerulus in response to 0.2% SV cider vinegar in control and DTKR knockdown flies. (C) Representative images of calcium responses to 0.4% SV of ethyl butyrate (1:100 dilution in mineral oil). Grey-scale images show the glomerular map on the DM5 plane whereas the pseudocolored images show the change of GCaMP fluorescence. (D) Peak ΔF/F in the DM5 glomerulus in response to ethyl butyrate in control and DTKR knockdown flies. All flies have GH146-LexA, LexAop-GCaMP, Orco-Gal4, and DTKRi flies have UAS-DTKR-RNAi in addition. For each condition, n = 4–9. Error bars show s.e.m. *p < 0.05, **p < 0.01; Student's t-test comparing the response between knockdown and control groups (A) and comparing between starved and fed responses (B, D). DOI: http://dx.doi.org/10.7554/eLife.08298.008
Figure 3.
Figure 3.. Tachykinin released by antennal lobe local interneurons (LNs) is necessary for starvation-dependent suppression of DM5 glomerular activity.
(A) Representative traces showing ΔF/F in the DM5 glomerulus in flies that have UAS-DTK-RNAi in ORNs (Orco-Gal4) or in LNs (GH298-Gal4). Bar graph depicts peak ΔF/F for each indicated genotype. Calcium signals for PN responses were imaged using GH146-LexA, LexAop-GCaMP flies in addition to the indicated transgenes. n = 5 for each condition. (B) The appetitive index of DTK knockdown flies in response to 5% cider vinegar. n = 87–101 for each condition. For imaging experiments, Error bars show s.e.m. *p < 0.05, Student's t-test (A) and z-test for proportions (B) comparing GH298-Gal4, UAS-DTK-RNAi group to control groups or Orco-Gal4, UAS-DTK-RNAi group. DOI: http://dx.doi.org/10.7554/eLife.08298.009
Figure 4.
Figure 4.. sNPF and DTK modulatory mechanisms target different sensory neurons.
(A, B) Representative traces of calcium activity (left) in the DM1 and DM5 PNs in response to olfactory nerve stimulation before and after bath application of sNPF (A) or DTK (B) synthetic peptides. The percent facilitation and suppression (right) are measured as the percent change in peak ΔF/F after peptide addition. (C) Peak ΔF/F responses in the DM1 PNs (left) and the DM5 PNs (right) to cider vinegar with glomerulus specific neuropeptide receptor knockdown. (D) The appetitive index of starved flies with glomerulus specific neuropeptide receptor knockdown. (E, F) Expression of NaChBac sensitizes DM1 and DM5 (left), which alters appetitive behavior in opposite directions (right). For imaging experiments (n = 5–6), 0.2% and 80% SV cider vinegar was used to stimulate the DM1 and DM5 PNs, respectively. For the behavioral experiments (n = 53–111), 5% cider vinegar was used. Error bars show s.e.m. *p < 0.05, **p < 0.01, ***p < 0.001; t-test for the imaging results, comparing between starved and fed responses; z-test for the behavioral results comparing knockdown groups to Gal4 or UAS control groups. DOI: http://dx.doi.org/10.7554/eLife.08298.010
Figure 5.
Figure 5.. Insulin controls DTKR signaling.
(A) Peak ΔF/F responses of the DM5 glomerulus to cider vinegar (left) and the appetitive index of flies (right) that were fed overnight with 4% sucrose alone or sucrose with the PI3K blocker, wortmannin. DTKRi flies contained the DTKR-RNAi in Orco-Gal4. (B) Peak ΔF/F responses of the DM5 glomerulus to cider vinegar (left) and the appetitive index of starved flies (right) that expressed constitutively active insulin receptor (InR-CA) in the Orco ORNs or selectively in Or85a neurons. For imaging experiments, PN responses to 80% SV cider vinegar were measured using GH146-LexA, LexAop-GCaMP flies. n = 5–13 for each condition. For behavior experiments, fly responses to 5% apple cider vinegar were measured. n = 67–91 for each condition. Error bars show s.e.m. *p < 0.05, **p < 0.01, ***p < 0.001; Student's t-test (imaging results) and z-test for proportions (behavioral results) comparing wortmannin-fed group to sugar-fed group (A), and comparing the InR-CA groups to the control counterpart (B). DOI: http://dx.doi.org/10.7554/eLife.08298.011
Figure 6.
Figure 6.. How starvation changes early olfactory processing.
(A) A schematic diagram depicting anatomical locations for Or42b and Or85a ORNs in the fly antenna as well as their corresponding glomeruli, DM1 and DM5, respectively, in the antennal lobe. LNs release DTK peptide broadly throughout the antennal lobe. (B) A model for how starvation state fine-tunes ORN sensitivity via the actions of neuromodulation of Or42b/DM1 and Or85a/DM5. In the starvation state, sNPF sensitizes the DM1 glomerular responses through additive gain modulation. Tachykinin suppresses DM5 glomerular responses through a divisive gain modulation. (C) The concerted effect of these two neuromodulatory systems increases behavioral attraction and expands the concentration range over which attraction to vinegar manifests. (D) In the DM1 glomerulus, both DTK and sNPF are available and released from the LNs and ORNs, respectively, in both the fed and starved states. DTKR is also present in these terminals in the fed state. Upon starvation, loss of insulin signaling leads to selective upregulation of sNPFR expression in the Or42b ORNs, which leads to their presynaptic facilitation. (E) In the DM5 glomerulus, both DTK and sNPF are available and released from the LNs and ORNs, respectively, in both the fed and starved states. Upon starvation, loss of insulin signaling leads to upregulation of DTKR expression in the Or85a ORNs, leading to their presynaptic inhibition. DOI: http://dx.doi.org/10.7554/eLife.08298.012

Comment in

  • Catching more flies with vinegar.
    Jouandet GC, Gallio M. Jouandet GC, et al. Elife. 2015 Sep 9;4:e10535. doi: 10.7554/eLife.10535. Elife. 2015. PMID: 26350701 Free PMC article.

References

    1. Ai M, Min S, Grosjean Y, Leblanc C, Bell R, Benton R, Suh GS. Acid sensing by the Drosophila olfactory system. Nature. 2010;468:691–695. doi: 10.1038/nature09537. - DOI - PMC - PubMed
    1. Anders S. HTSeq: Analysing high-throughput sequencing data with Python. 2010 http://www-huber.embl.de/users/anders/HTSeq - PMC - PubMed
    1. Asahina K, Watanabe K, Duistermars BJ, Hoopfer E, Gonzalez CR, Eyjolfsdottir EA, Perona P, Anderson DJ. Tachykinin-expressing neurons control male-specific aggressive arousal in Drosophila. Cell. 2014;156:221–235. doi: 10.1016/j.cell.2013.11.045. - DOI - PMC - PubMed
    1. Bargmann CI, Marder E. From the connectome to brain function. Nature Methods. 2013;10:483–490. doi: 10.1038/nmeth.2451. - DOI - PubMed
    1. Barsh GS, Schwartz MW. Genetic approaches to studying energy balance: perception and integration. Nature Reviews. Genetics. 2002;3:589–600. doi: 10.1038/nrg862. - DOI - PubMed

Publication types