. 2015 Sep 22;6(28):24823-41.
doi: 10.18632/oncotarget.4485.

Combination of antibodies directed against different ErbB3 surface epitopes prevents the establishment of resistance to BRAF/MEK inhibitors in melanoma

Affiliations

Combination of antibodies directed against different ErbB3 surface epitopes prevents the establishment of resistance to BRAF/MEK inhibitors in melanoma

Luigi Fattore et al. Oncotarget. .

Abstract

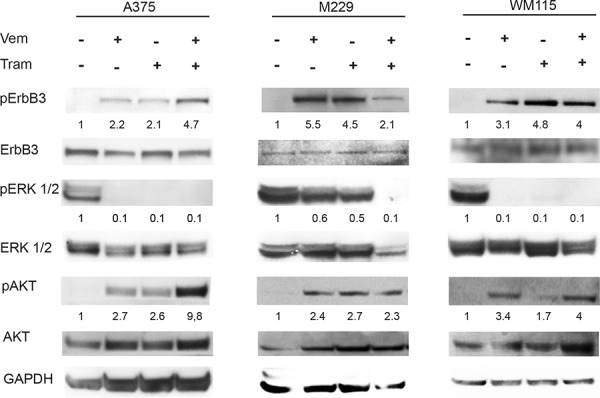
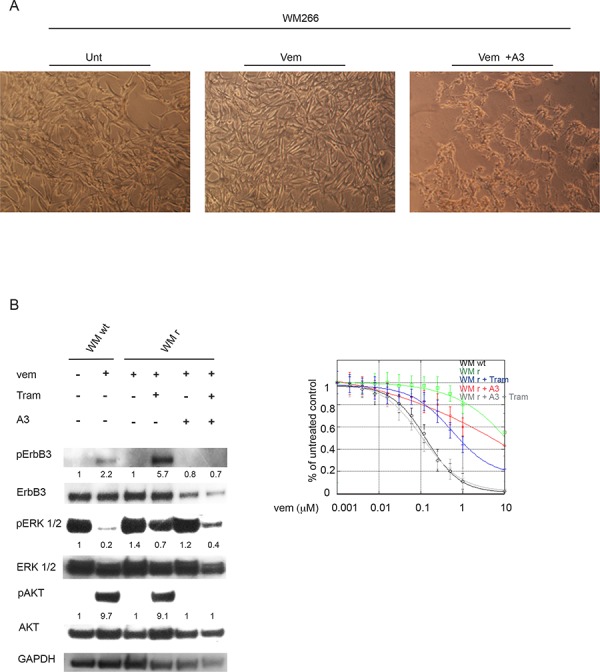
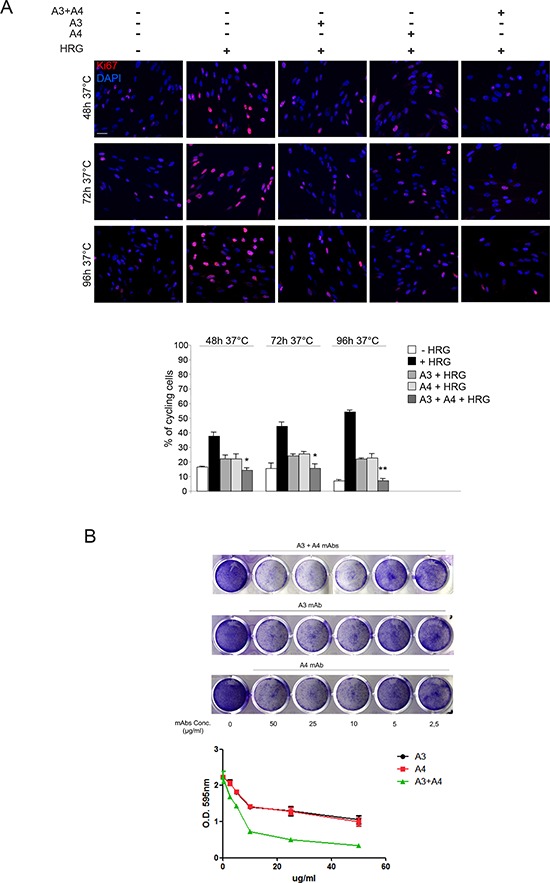
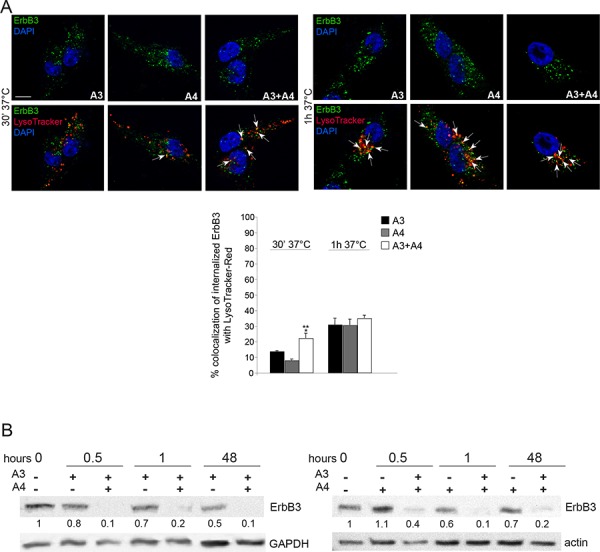
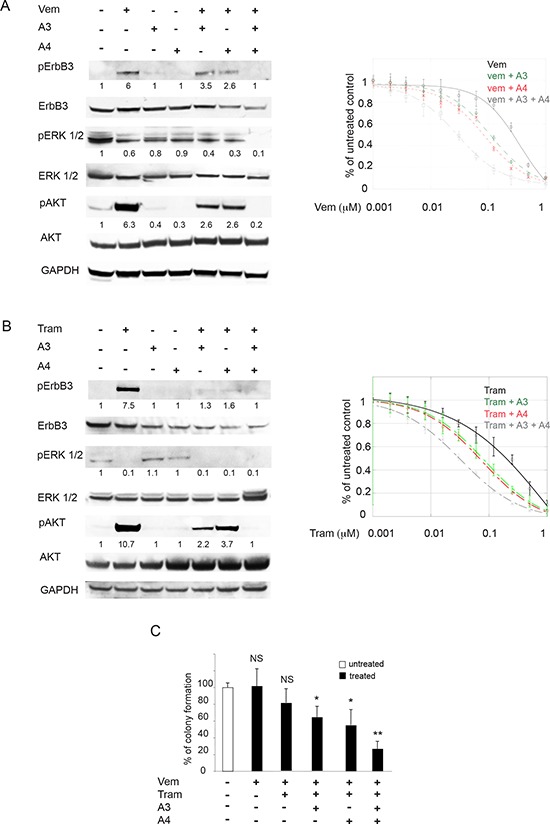
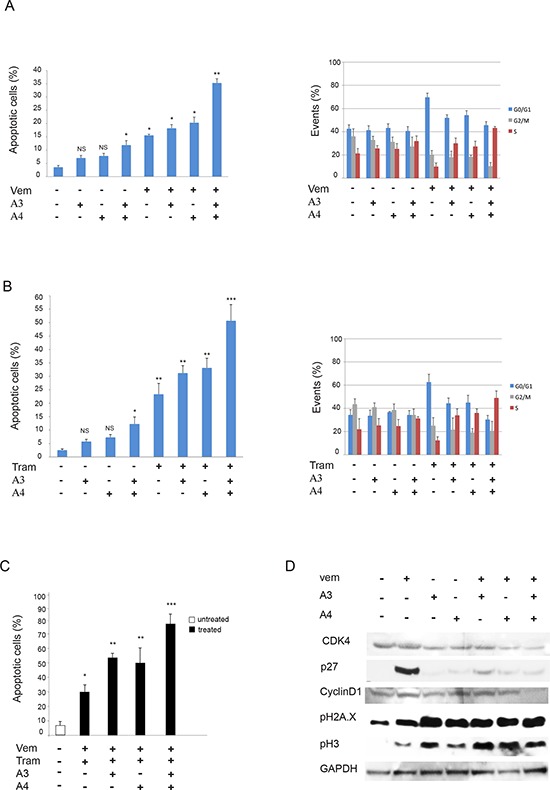
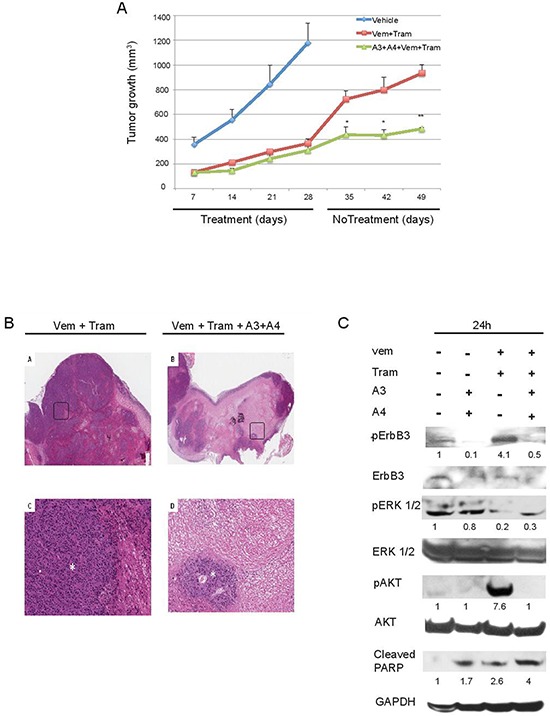
Patients with metastatic melanoma bearing V600 mutations in BRAF oncogene clinically benefit from the treatment with BRAF inhibitors alone or in combination with MEK inhibitors. However, a limitation to such treatment is the occurrence of resistance. Tackling the adaptive changes helping cells survive from drug treatment may offer new therapeutic opportunities. Very recently the ErbB3 receptor has been shown to act as a central node promoting survival of BRAF mutated melanoma. In this paper we first demonstrate that ErbB3/AKT hyperphosphorylation occurs in BRAF mutated melanoma cell lines following exposure to BRAF and/or MEK inhibitors. This strongly correlates with increased transcriptional activation of its ligand neuregulin. Anti-ErbB3 antibodies impair the establishment of de novo cell resistance to BRAF inhibition in vitro. In order to more potently ablate ErbB3 activity we used a combination of two anti-ErbB3 antibodies directed against distinct epitopes of its extracellular domain. These two antibodies in combo with BRAF/MEK inhibitors potently inhibit in vitro cell growth and tumor regrowth after drug withdrawal in an in vivo xenograft model. Importantly, residual tumor masses from mice treated by the antibodies and BRAF/ERK inhibitors combo are characterized almost exclusively by large necrotic areas with limited residual areas of tumor growth. Taken together, our findings support the concept that triple therapy directed against BRAF/MEK/ErbB3 may be able to provide durable control of BRAF mutated metastatic melanoma.

Keywords: Anti-ErbB3 antibodies; BRAF/MEK inhibitors; ErbB3 activation; in vivo regrowth impairment; melanoma.


Conflict of interest statement

CONFLICTS OF INTEREST

L.F., D.M., A.N., C.D.V., M.E.P., P.C., R.C., M.R.T., R.M., and G.C. declare no conflict of interest.

E.M., G.R. and L.A. are employees of Takis S.r.l.

A.R. served as consultant for Amgen, Genentech-Roche, GSK, Merck, Novartis and Pierre Fabre with the honoraria paid to UCLA. He has stock in Kite Pharma and Compugen.

P.A.A. served as consultant/for BMS, Roche-Genentech, MSD, GSK, Ventana, Novartis, and Amgen. He received research funds from BMS, Roche-Genentech, Ventana.

Figures

Figure 1
Figure 1. Vemurafenib and/or Trametinib treatments induce selective ErbB3 phosporylation and AKT activation in melanoma cells
A375, M229 and WM115 cells were serum starved for 24 h, treated or not with vemurafenib (0.3 μM), with trametinib (0.15 μM) or with their combination for 24 h. Western blot analysis performed using the indicated antibodies shows that both vemurafenib and trametinib induce a strong phosphorylation of ErbB3 (Y1289) and AKT (S473). For densitometric analysis results are expressed as mean values from three independent experiments.
Figure 2
Figure 2. Anti-ErbB3 mAbs restore drug sensitivity to vemurafenib in resistant melanoma cells
WM266 human melanoma cells were treated for about two months with increasing drug concentrations every two weeks (from 50 nM to 10 μM) in order to generate vemurafenib resistant cells. A. Magnifications of cells show that the combination of vemurafenib (at the initial concentration of 50 nM) with the anti-ErbB3 antibody A3 (at the concentration of 10 μg/ml) decreases cell viability compared to untreated (Unt) or vemurafenib-treated (Vem) after two week of treatment. The pictures shown are representative of three indipendent experiments. B. WM266 melanoma cells resistant to vemurafenib (WM r) were serum starved and treated with vemurafenib (0.3 μM), with trametinib (0.15 μM) or with their combination in presence or not of anti-ErbB3 mAb A3 (20 μg/ml) for 24 h. Western blot analysis shows that A3 mAb abrogate ErbB3 phosphotylation (Y1289) as well as the strong increase of pAKT (S473) induced by trametinib in vemurafenib resistant WM266 cells (WM r). WM266 wild type cells (WM wt) were used as positive control. For densitometric analysis results are expressed as mean values from three independent experiments. C. WM r cells were grown in the presence of different doses of vemurafenib and combined or not with trametinib (0.15 μM), A3 mAb (20 μg/ml) or their combination for 10 day. Cells were stained with crystal violet and then dissolved in a Methanol/SDS solution and the adsorbance (595 nm) was read using a microplate ELISA reader. Quantitative analysis for curve fitting and for IC50 evaluation, performed by KaleidaGraph software, shows that either trametinib (at a greater extent) or A3 (at a lower extent) are able to partially restore cell sensitivity to vemurafenib, but only the co-treatment of the resistant clones with both molecules is able to fully restore cells sensitivity to vemurafenib. IC50 Vem WM wt = 0.16 μM; IC50 Vem WM r = 7 μM; IC50 Vem WM r + Tram = 0.77 μM; IC50 Vem WM r + A3 = 3 μM; IC50 Vem WM r + Tram + A3 = 0.1 μM. p-values were calculated using Student's t test and significance level has been defined as p < 0.05. For IC50 Vem WM r + Tram + A3 p < 0.001 vs IC50 Vem WM r cells. For IC50 Vem WM r + Tram p < 0.05 vs IC50 Vem WM r cells. For IC50 Vem WM r + A3 NS vs IC50 Vem WM r. WM wt were used as control.
Figure 3
Figure 3. Combination of anti-ErbB3 mAbs is more effective in inhibiting melanoma cell growth compared to the single treatments
A. MST-L cells were pre-treated with each mAb or their combination and then incubated with NRG1 (HRG) for 48, 72 and 96 h in the presence of the antibodies, fixed and stained with anti-Ki67 antibodies to identify cycling cells. Quantitative analysis of the percentage of cells presenting Ki67-positive nuclei was performed as reported in materials and methods and values are expressed as mean values ± standard errors (SE). Student's t test was performed and significance level has been defined as described in materials and methods. The increase of the proliferation rate upon 48, 72 and 96 h of NRG1 stimulation is inhibited either by mAbs combination and A3/A4 individually. Cell growth inhibition induced by mAbs combination is particularly pronounced after 96 h of treatment comapred to single mAbs. *p < 0.05 vs. the corresponding NRG1-treated cells, **p < 0.001 vs. the corresponding HRG-treated cells. Bar = 10 μm. B. MST-L cells were grown in the presence of different doses A3 and A4 alone or in combination for 10 days. Cells were then fixed and stained with crystal violet (upper part). Cells were then dissolved in a Methanol/SDS solution and the adsorbance (595 nm) was read using a microplate ELISA reader. Quantitative analysis for curve fitting and for IC50 evaluation, performed by GraphPad software, shows that A3 and A4 combination is able to inhibit melanoma cell growth better than the single treatments. EC50 A3 = 38 μg/mL; EC50 A4 = 35 μg/mL; EC50 A3 + A4 = 7 μg/mL. The Combination Index (CI) evaluation, performed by CalcuSyn software as reported in materials and methods, indicate that A3 and A4 are synersistic drugs; CI = 0.7.
Figure 4
Figure 4. Combination of anti-ErbB3 mAbs is more effective in inducing receptor internalization and degradation
A. MST-L cells were treated with A3, A4 or their combination for 30′ and 1 h at 37°C in the presence of LysoTracker-Red as reported in materials and methods. Quantitative immunoflorescence analysis of the percentage of colocalization of signals and 3D reconstruction was performed as described in materials and methods. Results are expressed as mean values ± SE (standard errors): the percentage of colocalization was calculated analyzing a minimum of 50 cells for each treatment randomly taken from three independent experiments. Student's t-test was performed and significance level has been defined as described in materials and methods. A colocalization of ErbB3-bound A3, A4 and their combination with the LysoTracker marker in intracellular, perinuclear dots corresponding to lysosomes is evident. mAbs combination strongly accelerate receptor targeting to the lysosomal compartment compared to single treatments. **p < 0.001 vs. the corresponding A3 or A4-treated cells; the slight increase of colocalization of combination compared to single treatments at 1 h is not significant. Bar = 10 μm. B. Western blot analysis using anti-ErbB3 polyclonal antibodies in MST-L cells treated with A3, A4 or their combination at 37°C for the different time points (0.5, 1, 48 h). A drastic decrease of the band corresponding to ErbB3 is evident after mAbs combination treatments compared to single mAbs. The equal loading was assessed with anti-actin antibody and densitometric analysis was performed as described in materials and methods.
Figure 5
Figure 5. Anti-ErbB3 mAbs combination counteracts the increase of receptor phosphorylation and potentiate growth inhibition induced by vemurafenib and trametinib better than the single mAbs
M14 melanoma cells serum starved and treated with vemurafenib (0.3 μM) A. left part or trametinib (0.15 μM) B. left part) for 24 h were incubated with 20 μg/ml of anti-ErbB3 mAbs A3, A4 or their combination. Western blot analysis shows that only mAbs combination completely abrogates receptor phosphorylation (Y1289) and ATK signaling (S473). For densitometric analysis results are expressed as mean values from three independent experiments. M14 cells were grown in the presence of different doses of vemurafenib A. right part or trametinib B. right part alone or in combination with 20 μg/ml of anti-ErbB3 mAbs A3, A4 or their combination for 10 days. Cells were then treated as described above. Quantitative analysis, performed by KaleidaGraph software as described above, shows that the combination of A3 and A4 enhances the inhibitory effect of vemurafenib and trametinib on cell growth better than the single mAbs. IC50 vem = 0.35 μM; IC50 vem + A3 = 0.11 μM; IC50 vem + A4 = 0.08 μM; IC50 vem + A3 + A4 = 0, 03 μM. IC50 tram = 0.21 μM; IC50 tram + A3 = 0.08 μM; IC50 tram + A4 = 0.07 μM; IC50 tram + A3 + A4 = 0.02. Results are reported as mean values ± standard deviation (SD) from three independent experiments. p-values were calculated using Student's t test and significance level has been defined as p < 0, 05. For IC50 vem + A3, IC50 vem + A4, IC50 tram + A3 and IC50 tram + A4 p < 0, 001 vs IC50 vem and IC50 tram respectively. For IC50 vem + A3 + A4 and IC50 tram + A3 + A4 p < 0, 0001 vs IC50 vem and IC50 tram respectively. C. Cells were treated with suboptimal doses of vemurafenib and/or trametinib alone or in combination with A3 and/or A4 mAbs. The in vitro colony formation assay shows that the addition of mAbs combination inhibits cells growth better than the single mAbs. *p < 0, 01 vs untreated cells; **p < 0, 001 vs untreated cells; NS vs untreated cells.
Figure 6
Figure 6. Anti-ErbB3 mAbs combination induces melanoma cell apoptosis better than the single mAbs when combined with vemurafenib and/or trametinib
M14 melanoma cells treated with vemurafenib (1 μM) A. left part or trametinib (0.5 μM) B. left part for 48 h were incubated with 20 μg/ml of anti-ErbB3 mAbs A3, A4 or their combination. Apoptosis induction, evaluated by FACS analysis, shows that the combination of A3 and A4 enhances the apoptotic effect of vemurafenib and trametinib better than the single mAbs. *p < 0, 01 vs untreated cells; **p < 0, 005 vs untreated cells; ***p < 0, 001 vs untreated cells; NS vs untreated cells. M14 cells treated as above for 24 h were assayed for cell cycle analysis by FACS. The results A and B. right parts show that combination of A3 and A4 + either vemurafenib or trametinib causes primarily a block in S-phase. C. Cells were treated with suboptimal doses of vemurafenib and/or trametinib alone or in combination with A3 and/or A4 mAbs for 48 h. The apoptosis induction, evaluated as above, shows that the addition of mAbs combination enhances the apoptotic effect of the drugs better than the single mAbs. *p < 0, 01 vs untreated cells; **p < 0, 001 vs untreated cells; NS vs untreated cells. *p < 0, 01 vs untreated cells; **p < 0, 005 vs untreated cells; ***p < 0, 001 vs untreated cells. D. M14 cells serum starved and treated with vemurafenib (1 μM) for 24 h were incubated with 20 μg/ml of anti-ErbB3 mAbs A3, A4 or their combination. Western blot analysis shows that co-treatment with vemurafenib and A3 + A4 causes a reduction of CDK4 and Cyclin D1 and an increase of the phosphorylation of histone H3 and gamma-H2AX.
Figure 7
Figure 7. Anti-ErbB3 mAbs combination reduces tumor relapse when combined with vemurafenib and trametinib
A. M14 melanoma cells were subcutaneously injected in immunodeficient mice at 1 × 10⁶ cells/mouse. Treatments started when tumors reached a 100 mm3 volume and mice were allocated six per group. Mice were treated with vehicle, vemurafenib (25 mg/kg) and trametinib (0, 5 mg/kg) alone or in combination with A3 and A4 mAbs (10 + 10 mg/kg) for four weeks. Tumor growth was measured once/weekly. The results show that the quadruple combination group is characterized by a durable control of tumor growth. *p < 0, 01 vs vehicle-treated mice; **p < 0, 005 vs vehicle-treated mice. B. Rapresentative images of histology of Vem + Tram-treated mice (left panel) and Vem + Tram + A3 + A4-treated mice (right panel). The quadruple combination-treated ones show a lower percentage of viable areas (asterisk) within the tumor mass and larger sheets of coagulative tumor cell necrosis compared to the Vem + Tram-treated tumors (A-B, H&E, original magnification x 20) (C-D, insert, H&E, original magnification x 200). C. Mice with M14 tumors grown subcutaneously were treated with a single dose of the vemurafenib/trametinib combination or with the quadruple combination vemurafenib + trametinib + A3/A4 for 24 h. Mice were then euthanized, tumor collected and total protein extracts analyzed by Western Blot. The results show that vemurafenib + trametinib induce phosphorylation of ErbB3 (Y1289) and AKT (S473) that is abrogated by anti-ErbB3 mAbs also in vivo.

Similar articles

Cited by

References

    1. Tsao H, Chin L, Garraway LA, Fisher ED. Melanoma: from mutations to medicine. Genes Dev. 2012;26:1131–1155. - PMC - PubMed
    1. Balch CM, Gershenwald JE, Soong SJ, Thompson JF. Update on the melanoma staging system: the importance of sentinel node staging and primary tumor mitotic rate. J Surg Oncol. 2011;104:379–85. - PubMed
    1. Korn EL, Liu PY, Lee SJ, Chapman JA, Niedzwiecki D, Suman VJ, Moon J, Sondak VK, Atkins MB, Eisenhauer EA, Parulekar W, Markovic SN, Saxman S, et al. Meta-analysis of phase II cooperative group trials in metastatic stage IV melanoma to determine progression-free and overall survival benchmarks for future phase II trials. J Clin Oncol. 2008;26:527–34. - PubMed
    1. Callahan MK, Wolchok JD. At the bedside: CTLA-4- and PD-1-blocking antibodies in cancer immunotherapy. J Leukoc Biol. 2013;94:41–53. - PMC - PubMed
    1. Menzies AM, Long GV. Systemic treatment for BRAF-mutant melanoma: where do we go next? Lancet Oncol. 2014;9:e371–81. - PubMed

Publication types

MeSH terms