. 2015 Aug 28;117(6):513-24.
doi: 10.1161/CIRCRESAHA.115.306341. Epub 2015 Jul 24.

Transcription Factor Runx2 Promotes Aortic Fibrosis and Stiffness in Type 2 Diabetes Mellitus

Affiliations

Transcription Factor Runx2 Promotes Aortic Fibrosis and Stiffness in Type 2 Diabetes Mellitus

Uwe Raaz et al. Circ Res. .

Abstract

Rationale: Accelerated arterial stiffening is a major complication of diabetes mellitus with no specific therapy available to date.

Objective: The present study investigates the role of the osteogenic transcription factor runt-related transcription factor 2 (Runx2) as a potential mediator and therapeutic target of aortic fibrosis and aortic stiffening in diabetes mellitus.

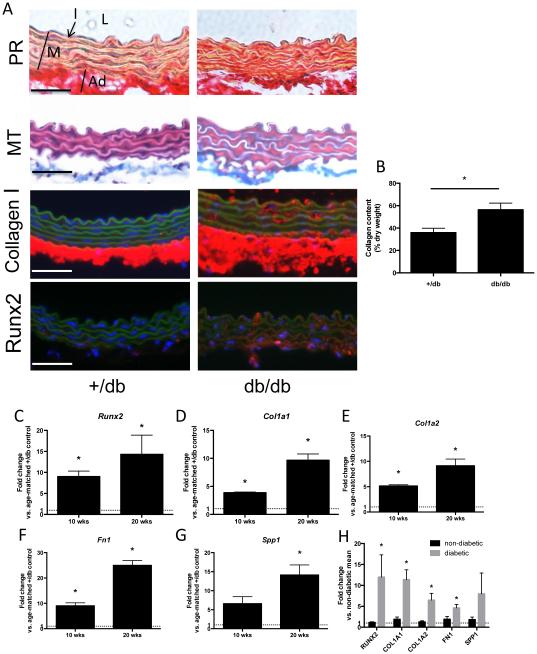
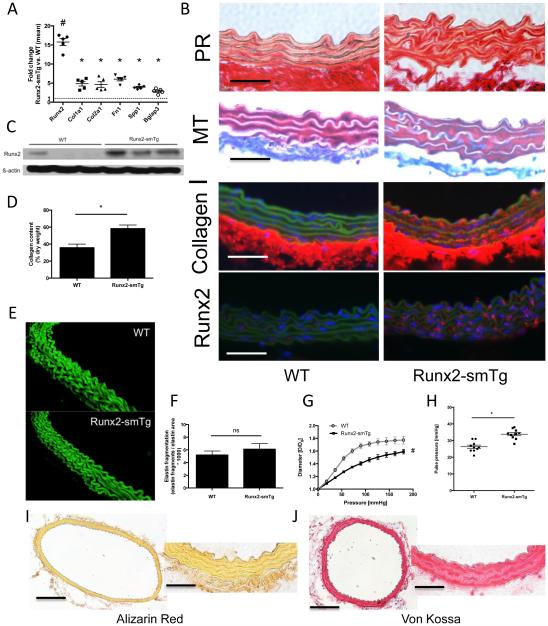
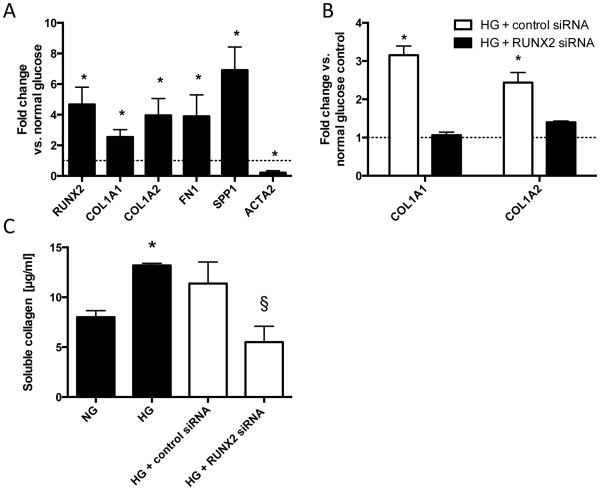
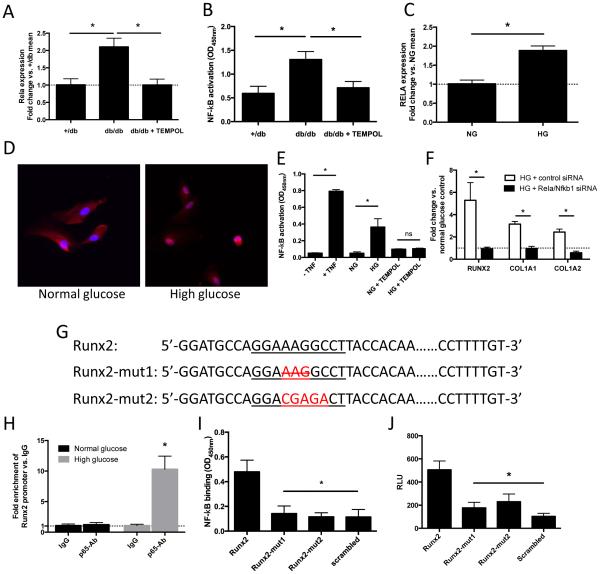
Methods and results: Using a murine model of type 2 diabetes mellitus (db/db mice), we identify progressive structural aortic stiffening that precedes the onset of arterial hypertension. At the same time, Runx2 is aberrantly upregulated in the medial layer of db/db aortae, as well as in thoracic aortic samples from patients with type 2 diabetes mellitus. Vascular smooth muscle cell-specific overexpression of Runx2 in transgenic mice increases expression of its target genes, Col1a1 and Col1a2, leading to medial fibrosis and aortic stiffening. Interestingly, increased Runx2 expression per se is not sufficient to induce aortic calcification. Using in vivo and in vitro approaches, we further demonstrate that expression of Runx2 in diabetes mellitus is regulated via a redox-sensitive pathway that involves a direct interaction of NF-κB with the Runx2 promoter.

Conclusions: In conclusion, this study highlights Runx2 as a previously unrecognized inducer of vascular fibrosis in the setting of diabetes mellitus, promoting arterial stiffness irrespective of calcification.

Keywords: arterial stiffness; diabetes mellitus; extracellular matrix; oxidative stress; smooth muscle cell.


Figures

Figure 1
Figure 1. db/db mice exhibit increasing aortic stiffness that precedes blood pressure elevations
(A) Passive pressure-diameter curves derived from pressure myography of 20-week old db/db and +/db aortae. Values are mean ± SEM. * p<0.05 vs +/db controls for pressure levels ≥ 36 mmHg. n=5/group. (B) Systolic, diastolic, mean and pulse pressure levels of 20-week old db/db mice and +/db controls. n=10/group. Values are mean ± SEM. * indicates p<0.05 (C) Pressure-diameter curves of 4,10, and 20 week-old db/db aortae. Values are mean ± SEM. * p<0.05 vs. db/db – 4wks (for pressure levels ≥ 36 mmHg); # p<0.05 vs. db/db – 10wks (for pressure levels ≥72 mmHg). (D) Systolic, diastolic, mean and pulse pressure levels of aging db/db mice. n=10/group. Values are mean ± SEM. * indicates p<0.05.
Figure 2
Figure 2. Expression of Runx2 and target genes is increased in db/db aortae and in human aortae from type 2 diabetes patients
(A) Aortic cross section from 20 week-old mice. Representative images of aortic cross section stained with Picrosirius Red (PR; collagen red, muscle yellow) and Masson’s Trichrome (MT; collagen blue, muscle red). Representative immunofluorescent images of aortic cross section stained for collagen I (red) or Runx2 (red). Green depicts the autofluorescence of the elastic lamella. Nuclei are Hoechst stained (blue). Original magnifications are 400x, scale bars 50 μm. In the upper left panel L indicates the aortic lumen, I points toward intimal layer, M identifies the aortic media and Ad the adventitia. (B) Total collagen content per aortic dry weight. n=4/group. * indicates p < 0.05. (C-G) Expression levels of Runx2 (C), Col1a1 (D) , Col1a2 (E), Fn1 (F), and Spp1 (G) in thoracic aortae of 10 weeks and 20 weeks old db/db mice compared to age-matched +/db controls. Values are expressed as fold changes relative to the mean expression level of +/db controls (=1; dotted line). * indicates p < 0.05 vs. +/db controls. n = 5/group (H) Expression levels of RUNX2, COL1A1, COL1A2, FN1 and SPP1 in thoracic aortae of diabetic patients (n=8) compared to non-diabetic patients (n=10). Values are expressed as fold changes relative to the mean expression level in non-diabetic patients (=1; dotted line). * indicates p < 0.05 vs. non-diabetic patients.
Figure 3
Figure 3. VSMC-specific Runx2-overexpression (Runx2-smTg mice) induces aortic medial fibrosis, stiffness and hypertension
(A) Expression levels of Runx2, Col1a1, Col1a2, Fn1, Spp1, and Bglap3 in thoracic aortae of 20 week-old Runx2-smTg mice compared to age-matched WT controls. Values are expressed as fold changes relative to the mean expression level in WT controls (=1; dotted line). # indicates p < 0.001 vs. WT controls, * indicates p < 0.05 vs. WT controls (n=5/group). (B) Aortic cross section from 20 week-old mice. Representative images of aortic cross section stained with Picrosirius Red (PR; collagen red, muscle yellow) and Masson’s Trichrome (MT; collagen blue, muscle red). Representative immunofluorescent images of aortic cross section stained for collagen I (red) or Runx2 (red). Green depicts the autofluorescence of the elastic lamella. Nuclei are Hoechst stained (blue). Original magnifications are 400x, scale bars 50 μm. (C) Aortic Runx2 protein expression in Runx2-smTg mice and WT controls. (D) Total collagen content per aortic dry weight. n=4/group. * indicates p < 0.05. (E) Representative images of aortic elastin lamellae (3D reconstruction of 28 individual layers). (F) Elastin fragmentation index quantified from 3 high power fields of 3 different aortas per group. (G) Aortic pressure-diameter curves from 20 weeks old mice. Values are mean ± SEM. # indicates p<0.05 vs. control for pressure levels ≥ 36 mmHg. (H) Pulse pressure derived from 20 week-old mice. * indicates p<0.05. n = 10/group (I,J) Representative images of thoracic aortic cross sections stained for calcium (Alizarin Red; I) and inorganic phosphate (von Kossa; J). Original magnifications are 100x (left panels; scale bars 200 μm) and 400x (right panels; scale bars 50 μm).
Figure 4
Figure 4. Antioxidant treatment (TEMPOL) reduces aortic Runx2 expression, medial fibrosis, aortic stiffness and pulse pressure in db/db mice
(A) In situ DHE staining of thoracic aortic section from 20 week-old db/db mice, with and without 10 weeks of prior TEMPOL treatment. ROS production was indicated by red fluorescence. Original magnification x400, scale bar 50 μm. (B) Average DHE intensity was quantified from 3 high power fields of 3 different aortas per group. * indicates p < 0.05 (C) Expression levels of Runx2, and its pro-fibrotic target genes Col1a1 and Col1a2 in thoracic aortae of 20 weeks old db/db mice with and without addition TEMPOL treatment. Values are expressed as fold changes relative to the mean expression level of +/db controls (=1; dotted line). * indicates p < 0.05. n = 5/group (D) Representative images of aortic cross section stained with Masson’s Trichrome (MT; collagen blue, muscle red). Representative immunofluorescent images of aortic cross section stained for collagen I (red) or Runx2 (red). Green depicts the autofluorescence of the elastic lamella. Nuclei are Hoechst stained (blue). Original magnifications are 400x, scale bars 50 μm. (E) Aortic Runx2 protein expression in db/db mice with and without TEMPOL treatment as well as in +/db controls. (F) Total collagen content per aortic dry weight. n=4/group. * indicates p < 0.05. (G) Aortic pressure-diameter curves from 20 weeks old db/db mice ± TEMPOL treatment. # indicates p<0.05 vs. control for pressure levels ≥ 90 mmHg. n= 5-7/group (H) Pulse pressure derived from 20 weeks old db/db mice with and without TEMPOL treatment. * indicates p<0.05. n=10/group
Figure 5
Figure 5. Runx2 mediates a pro-fibrotic response of human aortic smooth muscle cells (AoSMC) to high glucose stimulation
(A) Expression of RUNX2 and targets COL1A1, COL1A2, FN1, SPP1 and SMC differentiation marker ACTA2 following high glucose (HG) treatment. * indicates p<0.05 vs normal glucose + osmotic control. (B) Expression of COL1A1 and COL1A2 under high glucose treatment with and without additional siRNA-mediated knockdown of Runx2. Values are expressed as fold changes relative to the mean expression level of normal glucose controls (=1; dotted line).* indicates p<0.05 vs. corresponding normal glucose condition and Runx2-knockdown condition. (C) Soluble collagen content in supernatant from HG treated cells ± additional Runx2 knockdown.* indicates p<0.05 vs. normal glucose control (+osmotic control); # indicates p<0.05 vs. HG + control siRNA. Data from n = 3 – 4 independent experiments.
Figure 6
Figure 6. NF-κB is activated under high-glucose conditions in AoSMCs and induces transcription of Runx2
(A) Rela expression levels in thoracic aortae of 20 weeks old +/db mice as well as db/db mice with and without addition TEMPOL treatment. Values are expressed as fold changes relative to the mean expression level of +/db controls (=1; dotted line). * indicates p < 0.05. n = 5/group. (B) NF-κB activity in nuclear extracts isolated from db/db aortae with and without prior TEMPOL treatment as well as +/db controls. * indicates p < 0.05. n = 5/group. (C) RELA expression levels following high glucose (HG) treatment. Values are expressed as fold changes relative to the mean expression level of normal glucose (NG) controls (=1; dotted line). * indicates p < 0.05. n = 3 independent experiments. (D) AoSMCs stained for RelA (p65) (red) under high glucose and normal glucose + osmotic control conditions. Nuclei are Hoechst stained (blue). (E) NF-κB activity in nuclear extracts isolated from AoSMCs following stimulation with TNF-a (positive control), high glucose (HG), and HG with additional TEMPOL treatment. * indicates p<0.05 vs. cells without TNF-a treatment, normal glucose + osmotic control (NG) or NG + TEMPOL, respectively. (F) Expression of RUNX2, COL1A1 and COL1A1 under high glucose treatment with and without additional siRNA mediated knockdown of the NF-kB subunits RelA (p65) and NF-kB (p50). Values are expressed as fold changes relative to the mean expression level of normal glucose (NG) controls (=1; dotted line).* indicates p<0.05 (G) Predicted NF-kB (RelA; p65) binding site (underlined) within the human Runx2 promoter (Runx2); custom mutants of the NF-kB binding site with deletion of a base triplet (Runx2-mut1) and mutation of 5 consecutive bases (Runx2-mut2). (H) Chromatin immunoprecipitation (ChIP) analysis of Runx2 promoter enrichment after anti-p65 antibody immunoprecipitation. Values are fold enrichment relative to IgG control. * indicates p < 0.05 vs. IgG control. (I) Quantification of NF-kB (RelA, p65) binding capacity of DNA oligos containing the predicted p65 binding motif located within the Runx2 promoter (Runx2), two custom mutants (Runx2-mut1; Runx2-mut2), or a scrambled sequence (negative control). Solid-phase bound oligos were incubated with nuclear extracts form high glucose stimulated AoSMCs. * indicates p<0.05 vs. Runx2. (J) Luciferase activity in high glucose stimulated AoSMCs transfected with the intact promoter of Runx2 (Runx2), Runx2 mutants (Runx2-mut1 and Runx2-mut2), or with a scrambled promoter (negative control). * indicates p<0.05 vs. Runx2. Data from n = 5 independent experiments.

References

    1. Wild S, Roglic G, Green A, Sicree R, King H. Global prevalence of diabetes: estimates for the year 2000 and projections for 2030. Diabetes Care. 2004;27:1047–53. - PubMed
    1. Centers for Disease Control and Prevention . National Diabetes Statistics Report: Estimates of Diabetes and Its Burden in the United States, 2014. U.S. Department of Helath and Human Services; Atlanta, GA: 2014.
    1. Ryden L, Standl E, Bartnik M, Van den Berghe G, Betteridge J, de Boer MJ, Cosentino F, Jonsson B, Laakso M, Malmberg K, Priori S, Ostergren J, Tuomilehto J, Thrainsdottir I, Vanhorebeek I, Stramba-Badiale M, Lindgren P, Qiao Q, Priori SG, Blanc JJ, Budaj A, Camm J, Dean V, Deckers J, Dickstein K, Lekakis J, McGregor K, Metra M, Morais J, Osterspey A, Tamargo J, Zamorano JL, Deckers JW, Bertrand M, Charbonnel B, Erdmann E, Ferrannini E, Flyvbjerg A, Gohlke H, Juanatey JR, Graham I, Monteiro PF, Parhofer K, Pyorala K, Raz I, Schernthaner G, Volpe M, Wood D. Guidelines on diabetes, pre-diabetes, and cardiovascular diseases: executive summary. The Task Force on Diabetes and Cardiovascular Diseases of the European Society of Cardiology (ESC) and of the European Association for the Study of Diabetes (EASD) Eur Heart J. 2007;28:88–136. - PubMed
    1. Stehouwer C, Henry R, Ferreira I. Arterial stiffness in diabetes and the metabolic syndrome: a pathway to cardiovascular disease. Diabetologia. 2008;51:527–39. - PubMed
    1. Laurent S, Cockcroft J, Van Bortel L, Boutouyrie P, Giannattasio C, Hayoz D, Pannier B, Vlachopoulos C, Wilkinson I, Struijker-Boudier H. Expert consensus document on arterial stiffness: methodological issues and clinical applications. Eur Heart J. 2006;27:2588–605. - PubMed

Publication types

Substances