. 2015;11(9):1668-87.
doi: 10.1080/15548627.2015.1067362.

Cross-cancer profiling of molecular alterations within the human autophagy interaction network

Affiliations

Cross-cancer profiling of molecular alterations within the human autophagy interaction network

Chandra B Lebovitz et al. Autophagy. 2015.

Abstract

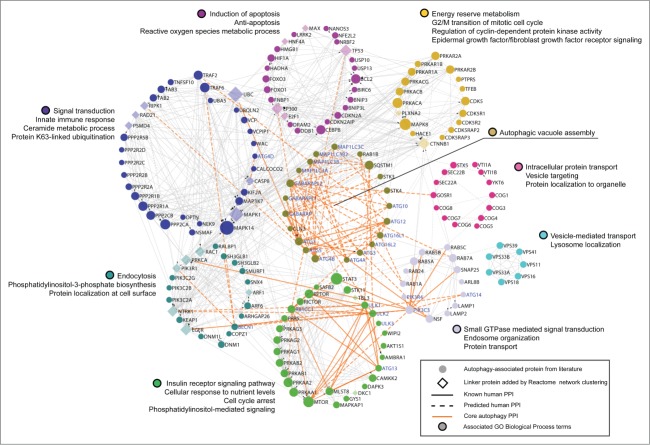
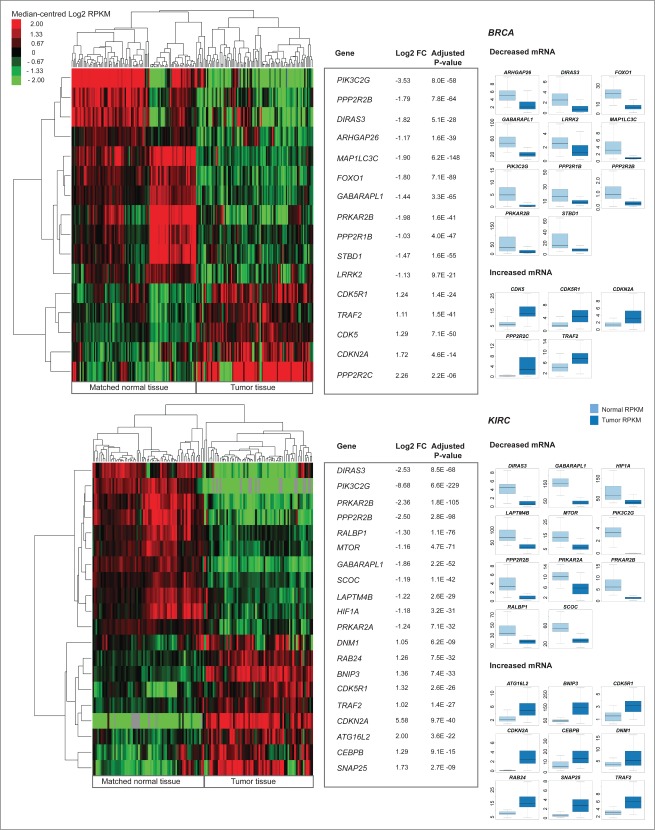
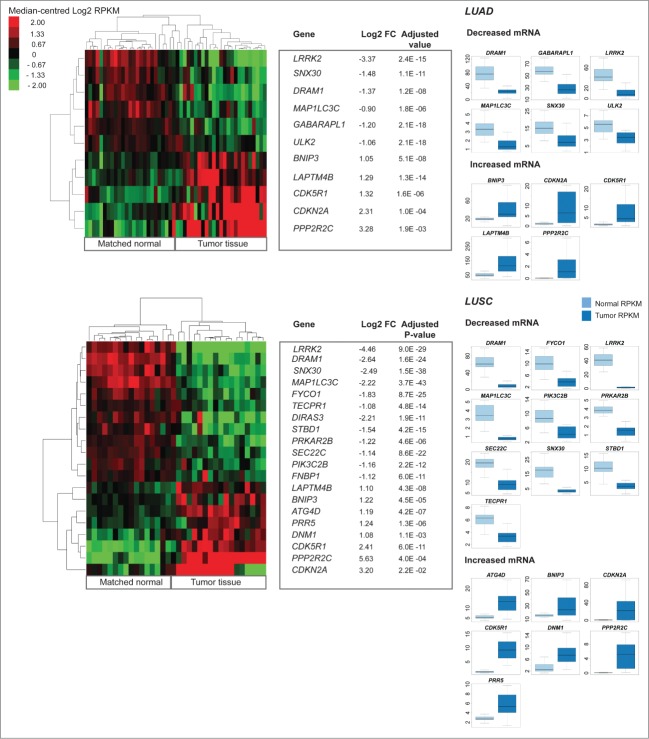
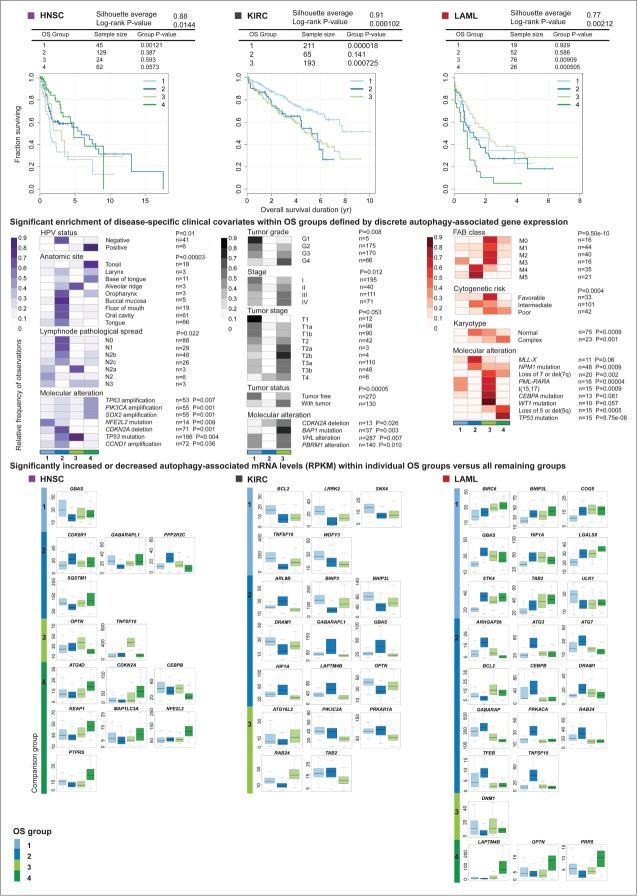
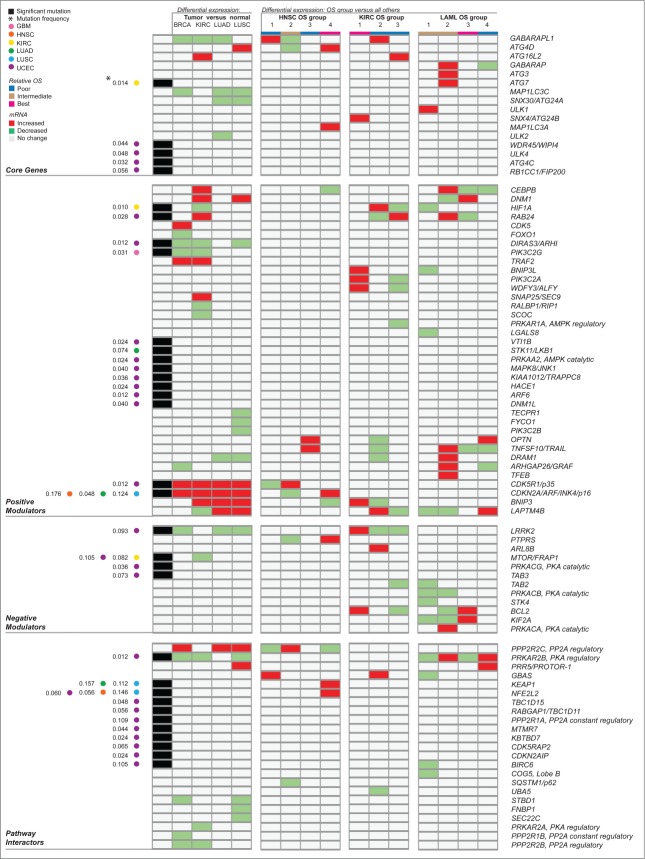
Aberrant activation or disruption of autophagy promotes tumorigenesis in various preclinical models of cancer, but whether the autophagy pathway is a target for recurrent molecular alteration in human cancer patient samples is unknown. To address this outstanding question, we surveyed 211 human autophagy-associated genes for tumor-related alterations to DNA sequence and RNA expression levels and examined their association with patient survival outcomes in multiple cancer types with sequence data from The Cancer Genome Atlas consortium. We found 3 (RB1CC1/FIP200, ULK4, WDR45/WIPI4) and one (ATG7) core autophagy genes to be under positive selection for somatic mutations in endometrial carcinoma and clear cell renal carcinoma, respectively, while 29 autophagy regulators and pathway interactors, including previously identified KEAP1, NFE2L2, and MTOR, were significantly mutated in 6 of the 11 cancer types examined. Gene expression analyses revealed that GABARAPL1 and MAP1LC3C/LC3C transcripts were less abundant in breast cancer and non-small cell lung cancers than in matched normal tissue controls; ATG4D transcripts were increased in lung squamous cell carcinoma, as were ATG16L2 transcripts in kidney cancer. Unsupervised clustering of autophagy-associated mRNA levels in tumors stratified patient overall survival in 3 of 9 cancer types (acute myeloid leukemia, clear cell renal carcinoma, and head and neck cancer). These analyses provide the first comprehensive resource of recurrently altered autophagy-associated genes in human tumors, and highlight cancer types and subtypes where perturbed autophagy may be relevant to patient overall survival.

Keywords: AML; LAPTM4B; SNV; SQSTM1; TCGA; autophagy; cancer; gene expression; mutation; tumor.


Figures

Figure 1.
Figure 1.
Network representation of core autophagy proteins, autophagy regulators and pathway interactors, clustered into functional modules of human protein-protein interactions by the Reactome Functional Interaction Network. Schematic showing the functional interconnectedness of 162 of 211 autophagy-associated proteins curated from literature. Edges represent human protein-protein interactions (PPI) reported in the Reactome database. Cellular functional compartments that are important in autophagy modulation are indicated by color-coded modules annotated by module-enriched GO Biological Process terms (FDR < 0.01). Node size ranks proteins by PPI count.
Figure 2.
Figure 2.
Circos plot overview of mutation frequency for significantly mutated autophagy-associated genes found in patients in 6 different cancers. Ribbons connect cancer type to mutated gene, ribbon color denotes levels of mutation frequency (range 0.012–0.176). Mutated genes were found to be under positive selection for somatic single nucleotide mutation, as assessed by an analysis of patterns of Darwinian selective pressure (adjusted P < 0.05). UCEC, uterine corpus endometrial carcinoma; LUSC, lung squamous cell carcinoma; LUAD, lung adenocarcinoma; HNSC, head and neck squamous cell carcinoma; KIRC, kidney renal clear cell carcinoma; GBM, glioblastoma multiforme.
Figure 3 (See previous page).
Differential gene expression analysis of pooled tumor versus pooled matched normal tissue gene abundance for 97 invasive breast carcinomas (BRCA) and 65 clear cell renal carcinomas (KIRC). (Right) Boxplots of normalized RNA-seq derived gene abundance (RPKM) displayed for autophagy-associated genes differentially expressed in tumor tissue compared to adjacent matched normal tissue in BRCA and KIRC patients. Differentially expressed genes showed significant (adjusted P < 0.05) differences in mRNA levels with a median fold-change > 2. (Left) Unsupervised clustering on only differentially expressed autophagy-associated genes (log2 transformed RPKM) grouped matched tumor and normal samples together.
Figure 4.
Figure 4.
Differential expression analysis of pooled tumor versus pooled matched normal gene abundance for 17 lung squamous cell carcinomas (LUAD) and 25 lung adenocarcinomas (LUSC). (Right) Boxplots of normalized RNA-seq derived gene abundance (RPKM) displayed for autophagy-associated genes differentially expressed in tumor tissue compared to adjacent matched normal tissue in LUAD and LUSC patients. Differentially expressed genes showed significant (adjusted P < 0.05) differences in mRNA levels with a median fold-change > 2. (Left) Unsupervised clustering on only differentially expressed autophagy-associated (log2 transformed RPKM) genes grouped matched tumor and normal samples together.
Figure 5 (See previous page).
Unsupervised consensus clustering of autophagy-associated tumor gene abundance stratified patient overall survival for acute myeloid leukemia (LAML), kidney clear cell renal carcinoma (KIRC), and head and neck squamous cell carcinoma (HNSC), linking differential expression of autophagy regulators and interactors to enriched clinical features within patient groups. Unsupervised consensus clustering by non-negative matrix factorization (NMF) on mRNA levels of 211 autophagy-associated genes stratified patients into groups of significantly different overall survival (Log rank P < 0.05). Kaplan-Meier curves of overall survival are shown for HNSC, KIRC, and LAML. Disease-specific clinical covariates (diagnostic, prognostic and molecular phenotypes) found to be enriched within overall survival (OS) groups following clustering (Fisher exact test P < 0.05) are drawn below respective cancer types. Patient status for each covariate was obtained from clinical metadata collected by TCGA. Patient counts (n) for each covariate are noted. Enrichment is depicted as color-coded distributions of the relative frequency of each feature across OS groups per cancer type. Differentially expressed autophagy-associated genes, identified within individual OS groups compared to all other OS groups combined (Wilcoxon rank sum test P < 0.05; median fold-change > 1.5), are reported per cancer type. Boxplots of normalized RNA-seq derived gene abundance (RPKM) of differentially expressed genes are drawn for each OS group.
Figure 6 (See previous page).
Summary by gene of molecular alterations found to target autophagy-associated genes across multiple cancer types. This overview includes all significant somatic point mutation and differential gene expression identified in autophagy-associated genes in this study. Significant results were obtained from a differential expression analysis of tumor versus matched adjacent normal tissue for 4 cancer types examined (BRCA, KIRC, LUAD, and LUSC; detailed in Figs. 3 and 4), as well as from a differential expression analysis between patient groups showing significantly different overall survival for 3 of 9 cancer types (HNSC, KIRC and LAML; detailed in Fig. 5). Rows represent autophagy-associated genes found to have at least one significant alteration (either mutation or differential expression) in at least one context investigated. Groups of columns describe a single, major analysis in this study. The first column reports genes found to be significantly mutated in any of 6 of 11 cancer types investigated (detailed in Fig. 2), with annotation of cancer type and mutation frequency found to the left. Cancer type, relative overall survival (OS) of patient groups, and value for differential expression of mRNA are color-coded, as described in the legend.

References

    1. Leone RD, Amaravadi RK. Autophagy: a targetable linchpin of cancer cell metabolism. Trends Endocrinol Metab 2013; 24:209-17; PMID:23474062; http://dx.doi.org/10.1016/j.tem.2013.01.008 - DOI - PMC - PubMed
    1. Yang ZJ, Chee CE, Huang S, Sinicrope FA. The role of autophagy in cancer: therapeutic implications. Mol Cancer Ther 2011; 10:1533-41; PMID:21878654; http://dx.doi.org/10.1158/1535-7163.MCT-11-0047 - DOI - PMC - PubMed
    1. Lebovitz CB, Bortnik SB, Gorski SM. Here, there be dragons: charting autophagy-related alterations in human tumors. Clin Cancer Res Off J Am Assoc Cancer Res 2012; 18:1214-26; PMID:22253413; http://dx.doi.org/10.1158/1078-0432.CCR-11-2465 - DOI - PubMed
    1. Vogelstein B, Papadopoulos N, Velculescu VE, Zhou S, Diaz LA, Kinzler KW. Cancer genome landscapes. Science 2013; 339:1546-58; PMID:23539594; http://dx.doi.org/10.1126/science.1235122 - DOI - PMC - PubMed
    1. Rung J, Brazma A. Reuse of public genome-wide gene expression data. Nat Rev Genet 2013; 14:89-99; PMID:23269463; http://dx.doi.org/10.1038/nrg3394 - DOI - PubMed

Publication types