

Mitochondrial metabolism in hematopoietic stem cells requires functional FOXO3
- PMID: 26209246
- PMCID: PMC4576984
- DOI: 10.15252/embr.201439704
Mitochondrial metabolism in hematopoietic stem cells requires functional FOXO3
Abstract
Hematopoietic stem cells (HSC) are primarily dormant but have the potential to become highly active on demand to reconstitute blood. This requires a swift metabolic switch from glycolysis to mitochondrial oxidative phosphorylation. Maintenance of low levels of reactive oxygen species (ROS), a by-product of mitochondrial metabolism, is also necessary for sustaining HSC dormancy. Little is known about mechanisms that integrate energy metabolism with hematopoietic stem cell homeostasis. Here, we identify the transcription factor FOXO3 as a new regulator of metabolic adaptation of HSC. ROS are elevated in Foxo3(-/-) HSC that are defective in their activity. We show that Foxo3(-/-) HSC are impaired in mitochondrial metabolism independent of ROS levels. These defects are associated with altered expression of mitochondrial/metabolic genes in Foxo3(-/-) hematopoietic stem and progenitor cells (HSPC). We further show that defects of Foxo3(-/-) HSC long-term repopulation activity are independent of ROS or mTOR signaling. Our results point to FOXO3 as a potential node that couples mitochondrial metabolism with HSC homeostasis. These findings have critical implications for mechanisms that promote malignant transformation and aging of blood stem and progenitor cells.
Keywords: FOXO3; HSC; ROS; metabolism; mitochondria.
© 2015 The Authors.
Figures

A, B Representative FACS histogram (left panel) and geometric mean fluorescence intensity normalized with WT (right panel) of ROS levels by chloromethyl dichlorodihydrofluorescein diacetate, CM-H2DCFDA (A), and mitoSOX Red (B) fluorescence are shown. One representative of three independent experiments (n = 3 mice per genotype) is shown.
C, D Representative FACS histograms of DiIC1(5) (C) and contour plots of JC-1 red and green fluorescence (D) in WT LSK treated (CCCP) or not (WT) with a ΔΨm inhibitor CCCP (carbonyl cyanide 3-chlorophenylhydrazone) 50 mM in vitro for 20 min.
E Histogram of TMRE fluorescence displaying shifts in fluorescence intensity after treatment with either CCCP or oligomycin in BM cells.

A–C Mitochondrial parameters as ATP level (A), oxygen consumption (B), and lactate production (C) were measured in WT and Foxo3−/− LT-HSC (LSKCD34−Flk2−) (n = 10 mice in each group), and experiments were performed in triplicate.
D–F Mitochondrial mass (D) and membrane potential (E, F) were measured in freshly isolated primitive hematopoietic stem and progenitor cells. (D) One representative FACS plot of the mitochondrial mass measured by the geometric mean fluorescence intensity of MitoTracker Green of 2 (LT-HSC, LSKCD48+CD150−) or 3 (LSK and c-Kit+) independent experiments (n = 3 mice per genotype) is shown: LT-HSC, P = 0.324; LSK, P = 0.021; and c-Kit+, P = 0.092. (E) One representative FACS plot of the mitochondria membrane potential measured by the geometric mean fluorescence intensity of 1,1′,3,3,3′,3′-hexamethylindodicarbo-cyanine iodide [DiIC1(5)] of 2 (LT-HSC, LSKCD48+CD150−) or 3 (LSK and c-Kit+) independent experiments (n = 3 mice per genotype) is shown: LT-HSC, P = 0.046; LSK, P = 0.042; and c-Kit+, P = 0.478. (F) Mitochondria membrane potential was also measured using 5,5′,6,6′-tetrachloro-1,1′,3,3′-tetraethylbenzimidazolyl-carbocyanine iodide (JC-1) probe by flow cytometry. Monomeric JC-1 has a green fluorescent emission spectrum while its aggregated form has a red fluorescent emission spectrum. As JC-1 probe accumulates, its aggregates and shifts fluorescent color. Representative FACS plots of JC-1 red and green fluorescence and relative ΔΨm measured by the red/green fluorescence ratio are shown for each population (n = 3 mice per genotype for LT-HSC and n = 6 mice per genotype for LSK and c-Kit+ cells).
G Histogram (top) and quantification (bottom) of TMRE fluorescence intensity comparing mitochondrial membrane potential between WT and Foxo3−/− LT-HSC. TMRE florescence normalized to WT TMRE levels in LT-HSC (n = 3 mice per group).

FACS-sorted LSK cells (10,000 cells) cytospun onto slides and stained with TOM20 (mitochondria-specific antibody) and a secondary conjugated to Alexa Fluor 488 and mounted with DAPI (60×). Images analyzed using ImageJ and the Mito-Morphology macro . Representative images are displayed with nucleus in blue and mitochondria in red. Outlines of mitochondrial networks based on TOM20 fluorescence intensity set at a threshold ≥ 170 a.u. are shown.
Quantification of perimeter and area of distinct mitochondrial networks using the Mito-Morphology macro. The average mitochondrion perimeter (left) or area (right) per cell analyzed and error bars represent SEM. *P < 0.05, Student’s t-test.
The circularity (left) of mitochondria was quantified, with higher values representing more circular mitochondria. Quantification of mitochondrial network interconnectivity (right) based on a ratio of the area to the perimeter, normalized to the circularity. Bars represent mean ± SEM. *P < 0.05, Student’s t-test.
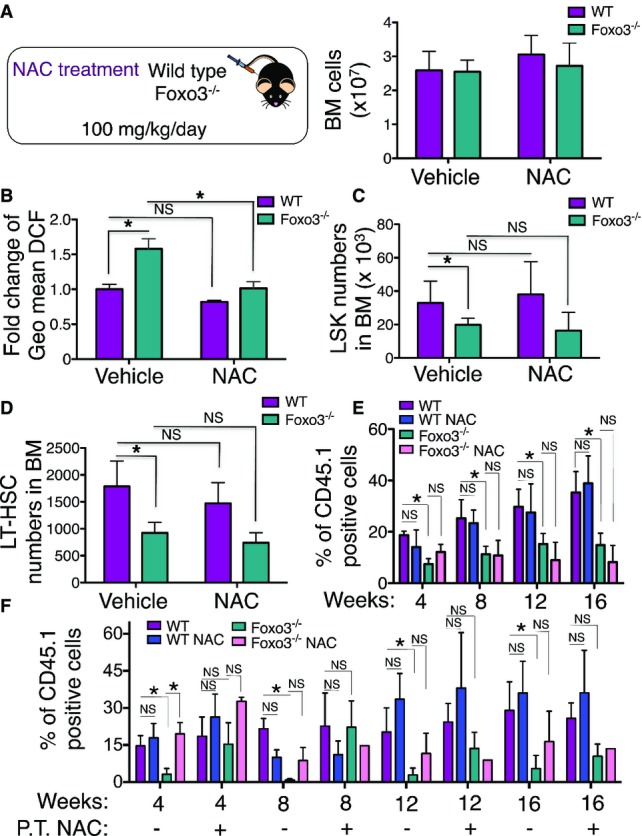
WT and Foxo3−/− mice were injected intraperitoneally daily with 100 mg/kg body weight of N-acetyl-L-cysteine (NAC) or vehicle control for 2 weeks (left panel). Total number of bone marrow (BM) cells isolated from one femur and one tibia (n = 6 mice per genotype) (right panel).
ROS levels were measured by flow cytometry in WT and Foxo3−/− LSK cells isolated after 2 weeks. Fold change of geometric mean normalized with WT of DCF fluorescence (n = 6 mice per genotype).
Total number of LSK cells in the BM (n = 6 mice per genotype).
Total number of LSKCD48−CD150+ (LT-HSC) cells in the BM (n = 6 mice per genotype).
Contribution of LT-HSC (CD45.1) from (A) to the peripheral blood (PB) of recipient mice (CD45.2) in a long-term competitive repopulation assay (n = 5 in each group).
Contribution of LSKCD48−CD150+ (LT-HSC) (CD45.1) isolated from NAC- or vehicle control-treated mice for 4 weeks to long-term competitive repopulation of lethally irradiated mice treated with NAC or vehicle control during post-transplantation (P.T.). One of two experiments is shown.


Quantification of ROS levels by DCF probe in LT-HSC after 4-week treatment with NAC or vehicle control prior to transplantation. Bars represent DCF fluorescence (mean ± SEM,n = 3). *P < 0.05, Student’s t-test.
Quantification of ROS levels in donor-derived peripheral blood cells at 16 weeks post-transplantation comparing all combinations of post- and pre-transplantation treatment with NAC. 16-week PB donor cells (ROS), post-transplant vehicle: WT-C = 4, KO-C = 4, WT-NAC = 5, KO-NAC=3; post-transplant NAC: WT-C = 4, KO-C = 3, WT-NAC = 3, KO-NAC = 1. Bars represent mean ± SEM.
Mitochondrial membrane potential quantification with TMRE in LSK cells. TMRE fluorescence (mean ± SEM), n = 3. n.s., not significant; *P < 0.05, Student’s t-test.
Quantification of ROS levels by DCF probe in LSK cells after treatment with NAC or vehicle control. Bars represent DCF fluorescence (mean ± SEM). *P < 0.05, Student’s t-test.

Mice were treated with NAC or vehicle control, and mitochondrial membrane potential was measured in freshly isolated cells after 2 weeks. Fold change of geometric mean of DilC1(5) fluorescence measured in LSK cells (n = 3 mice per genotype) normalized with vehicle-treated (WT).
Relative ΔΨm measured in LSK cells by the red/green fluorescence ratio of JC-1 probe (n = 6 mice per genotype).
TMRE quantification of mitochondrial membrane potential in LT-HSC isolated from mice treated with NAC or vehicle control (n = 3 mice).

qRT–PCR analysis of genes whose products are implicated in mitochondrial metabolism. Results are relative to WT set to one in each population.
qRT–PCR analysis of glycolytic genes. Results are relative to WT set to one in each population.

WT and Foxo3−/− mice were injected intraperitoneally with 4 mg/kg body weight of rapamycin on 5 consecutive days/week daily for 2 weeks (left upper panel). Analysis of phosphorylated form of S6K1 target ribosomal protein S6 (pS6) by flow cytometry in LSK cells isolated from WT and Foxo3−/− mice treated with rapamycin or vehicle control by flow cytometry measuring fold change of geometric mean of pS6 compared to negative control (Neg cont: anti-rabbit IgG-PE antibody only; right upper panel) and the percentage of pS6-positive cells (right lower panel). Representative FACS plots of pS6 expression (left lower panel). The anti-rabbit IgG-PE antibody only (Neg cont) and rapamycin treatment (3 μM) for 1 h in vitro before the LSK staining were used as negative controls of pS6 antibody. One representative of three independent experiments (n = 3 mice per group) is shown.
Fold change of geometric mean normalized with WT of DilC1(5) fluorescence measured in LSK cells isolated in (A) (right panel) (n = 6 mice per genotype).
Relative ΔΨm measured in LSK cells isolated in (A) by the red/green fluorescence ratio of JC-1 probe (n = 6 mice per genotype).
Fold change of geometric mean normalized with WT of DCF fluorescence (n = 6 mice per genotype).
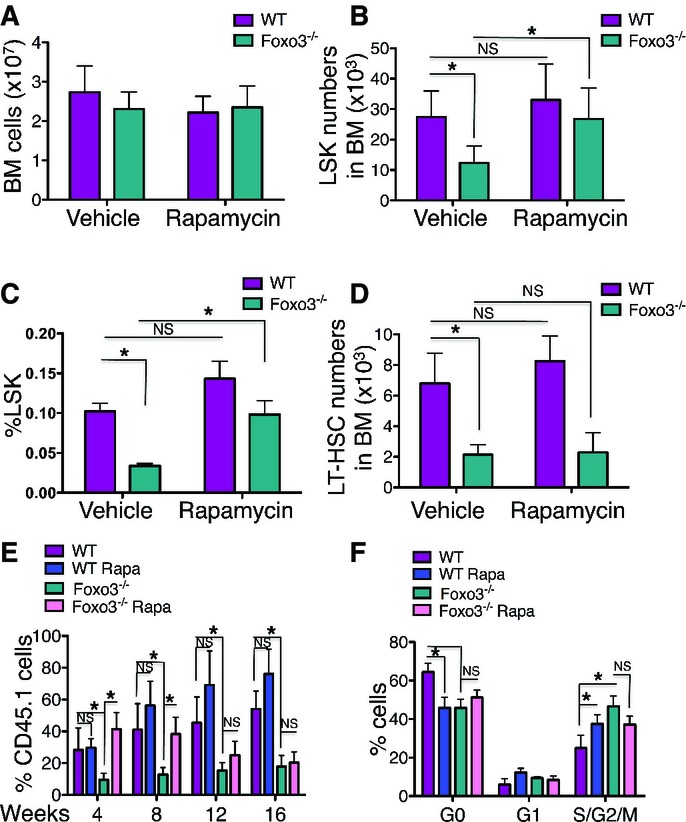
Total number of bone marrow (BM) cells isolated from one femur and one tibia from WT and Foxo3−/− mice treated with rapamycin or vehicle control (n = 10 mice per group).
Total number of LSK cells in the BM of mice from (A) (n = 10 mice per genotype).
Frequency of Lin−Sca-1+c-Kit+ cells (n = 10 mice per genotype).
Total number of LSKCD48−CD150+ (LT-HSC) cells in the BM of mice from (A) (n = 6 mice per genotype).
The contribution of transplanted LT-HSC (CD45.1) cells isolated from (A) to the PB of recipient mice (CD45.2) in a long-term competitive repopulation assay (n = 8 in each group).
Mean values of cell cycle distribution measured by Ki-67/DAPI staining of LSK cells isolated from (A) (n = 6 mice per genotype).

Similar articles
-
FOXO3 Transcription Factor Is Essential for Protecting Hematopoietic Stem and Progenitor Cells from Oxidative DNA Damage.J Biol Chem. 2017 Feb 17;292(7):3005-3015. doi: 10.1074/jbc.M116.769455. Epub 2016 Dec 19. J Biol Chem. 2017. PMID: 27994057 Free PMC article.
-
Mitochondria and FOXO3 in stem cell homeostasis, a window into hematopoietic stem cell fate determination.J Bioenerg Biomembr. 2017 Aug;49(4):343-346. doi: 10.1007/s10863-017-9719-7. Epub 2017 Jun 21. J Bioenerg Biomembr. 2017. PMID: 28639090 Free PMC article. Review.
-
Foxo3 is essential for the regulation of ataxia telangiectasia mutated and oxidative stress-mediated homeostasis of hematopoietic stem cells.J Biol Chem. 2008 Sep 12;283(37):25692-25705. doi: 10.1074/jbc.M800517200. Epub 2008 Apr 18. J Biol Chem. 2008. PMID: 18424439
-
SIRT3 deacetylates FOXO3 to protect mitochondria against oxidative damage.Free Radic Biol Med. 2013 Oct;63:222-34. doi: 10.1016/j.freeradbiomed.2013.05.002. Epub 2013 May 7. Free Radic Biol Med. 2013. PMID: 23665396
-
Stem Cells Seen Through the FOXO Lens: An Evolving Paradigm.Curr Top Dev Biol. 2018;127:23-47. doi: 10.1016/bs.ctdb.2017.11.006. Curr Top Dev Biol. 2018. PMID: 29433739 Review.
Cited by
-
Mitochondrial localization and moderated activity are key to murine erythroid enucleation.Blood Adv. 2021 May 25;5(10):2490-2504. doi: 10.1182/bloodadvances.2021004259. Blood Adv. 2021. PMID: 34032849 Free PMC article.
-
Hematopoietic Stem Cell Metabolism during Development and Aging.Dev Cell. 2020 Jul 20;54(2):239-255. doi: 10.1016/j.devcel.2020.06.029. Dev Cell. 2020. PMID: 32693057 Free PMC article. Review.
-
Oocyte Health and Quality: Implication of Mitochondria-related Organelle Interactions.Results Probl Cell Differ. 2024;73:25-42. doi: 10.1007/978-3-031-62036-2_2. Results Probl Cell Differ. 2024. PMID: 39242373 Review.
-
FoxO Transcription Factors: Applicability as a Novel Immune Cell Regulators and Therapeutic Targets in Oxidative Stress-Related Diseases.Int J Mol Sci. 2022 Oct 6;23(19):11877. doi: 10.3390/ijms231911877. Int J Mol Sci. 2022. PMID: 36233176 Free PMC article. Review.
-
Analysis of Hematopoietic Stem Progenitor Cell Metabolism.J Vis Exp. 2019 Nov 9;(153):10.3791/60234. doi: 10.3791/60234. J Vis Exp. 2019. PMID: 31762453 Free PMC article.
References
-
- Orford KW, Scadden DT. Deconstructing stem cell self-renewal: genetic insights into cell-cycle regulation. Nat Rev Genet. 2008;9:115–128. - PubMed
-
- Wilson A, Laurenti E, Oser G, der van Wath RC, Blanco-Bose W, Jaworski M, Offner S, Dunant CF, Eshkind L, Bockamp E, et al. Hematopoietic stem cells reversibly switch from dormancy to self-renewal during homeostasis and repair. Cell. 2008;135:1118–1129. - PubMed
-
- Sauvageau G, Iscove NN, Humphries RK. In vitro and in vivo expansion of hematopoietic stem cells. Oncogene. 2004;23:7223–7232. - PubMed
Publication types
MeSH terms
Substances
Grants and funding
LinkOut - more resources
Full Text Sources
Other Literature Sources
Medical
Molecular Biology Databases
Research Materials
Miscellaneous
