. 2015 Oct 1;108(1):188-96.
doi: 10.1093/cvr/cvv202. Epub 2015 Jul 24.

Transmural APD gradient synchronizes repolarization in the human left ventricular wall

Affiliations

Transmural APD gradient synchronizes repolarization in the human left ventricular wall

Bastiaan J Boukens et al. Cardiovasc Res. .

Abstract

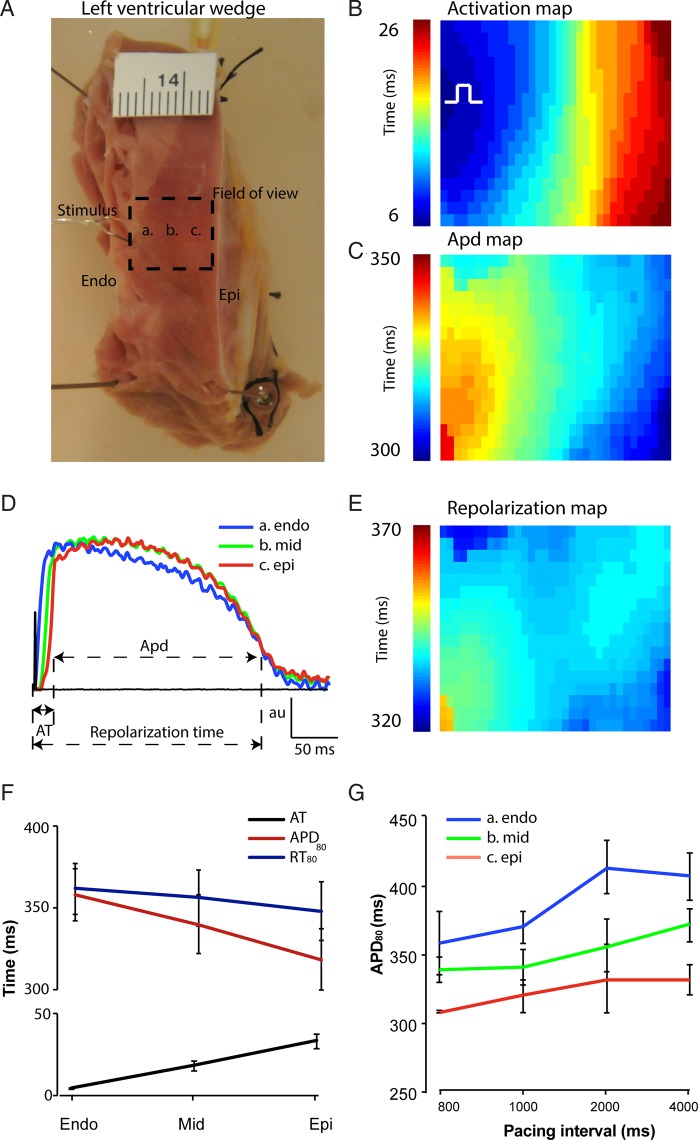
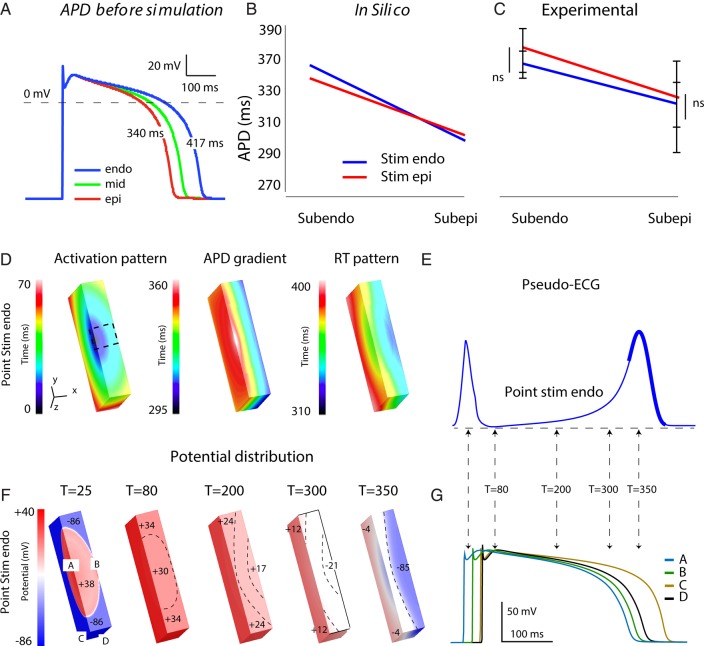
Aims: The duration and morphology of the T wave predict risk for ventricular fibrillation. A transmural gradient in action potential duration (APD) in the ventricular wall has been suggested to underlie the T wave in humans. We hypothesize that the transmural gradient in APD compensates for the normal endocardium-to-epicardium activation sequence and synchronizes repolarization in the human ventricular wall.

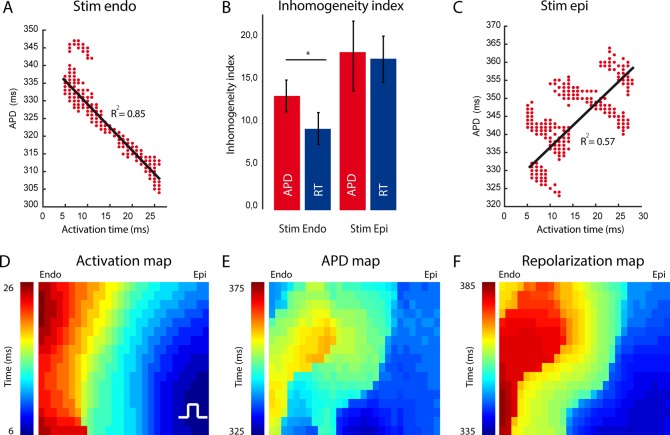
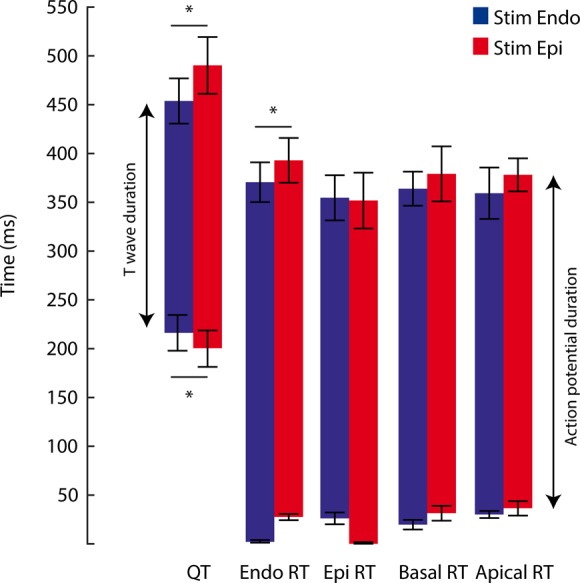
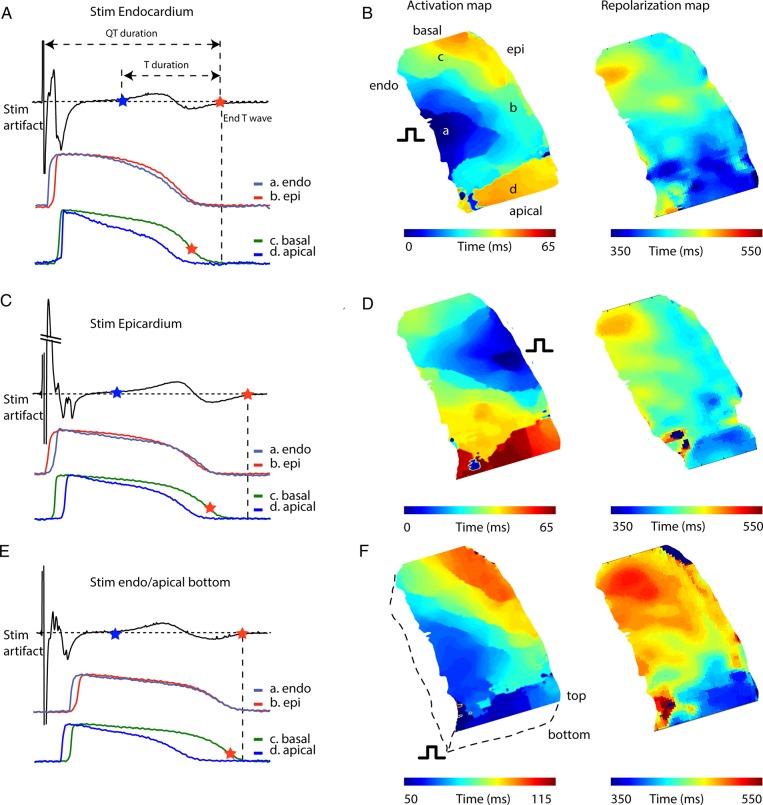
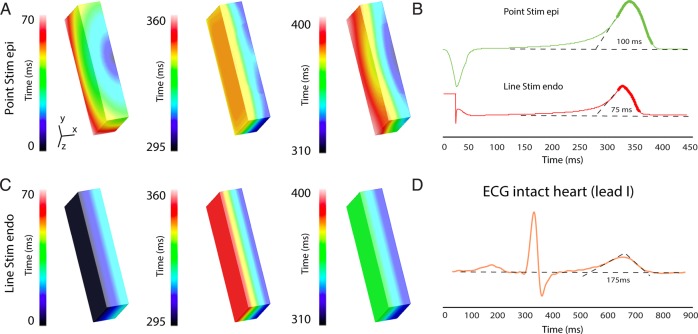
Methods and results: We made left ventricular wedge preparations from 10 human donor hearts and measured transmural activation and repolarization patterns by optical mapping, while simultaneously recording a pseudo-ECG. We also studied the relation between local timings of repolarization with the T wave in silico. During endocardial pacing (1 Hz), APD was longer at the subendocardium than at the subepicardium (360 ± 17 vs. 317 ± 20 ms, P < 0.05). The transmural activation time was 32 ± 4 ms and resulted in final repolarization of the subepicardium at 349 ± 18 ms. The overall transmural dispersion in repolarization time was smaller than that of APD. During epicardial pacing, the dispersion in repolarization time increased, whereas that of APD remained similar. The morphology of the T wave did not differ between endocardial and epicardial stimulation. Simulations explained the constant T wave morphology without transmural APD gradients.

Conclusion: The intrinsic transmural difference in APD compensates for the normal cardiac activation sequence, resulting in more homogeneous repolarization of the left ventricular wall. Our data suggest that the transmural repolarization differences do not fully explain the genesis of the T wave.

Keywords: Human; Optical mapping; Repolarization; T wave.


Figures

Figure 1
Figure 1
Gradient in APD and repolarization in the human left ventricular wall. (A) A photograph of a left ventricular tissue preparation. The dashed square represents the field of view and the letters a, b, and c correspond to the subendocardium, midmyocardium, and subepicardium, respectively. The ruler is in centimetres. (B) Activation pattern and (C) action potential gradient during endocardial stimulation within the field of view. The action potentials in (D) correspond to the area indicated by the letters in the photograph of (A). (E) Map shows the reconstructed repolarization gradient during endocardial stimulation. (F) The line graph shows the average APD and the local moment of activation and repolarization in the ventricular wall (n = 10). (G) The bar graph shows the average APD in the ventricular wall duration during different cycle lengths. Endo, subendocardial; Epi, subepicardial.
Figure 2
Figure 2
Relation between AT and APD during endocardial and epicardial stimulation. (A and C) The line graphs show the correlation between AT and APD and repolarization time during endocardial (A) and epicardial stimulation (C) (n = 5). (B) The bar graph shows the inhomogeneity level of APD and RT distribution during endocardial and epicardial stimulation. (D) Activation pattern within the field of view during epicardial stimulation. (E) Action potential gradient. (F) Repolarization pattern during epicardial stimulation. Endo, subendocardial; Epi, subepicardial.
Figure 3
Figure 3
T wave in relation to local repolarization on transmural surface. The bar graph shows the QT interval calculated from pseudo-ECGs recorded from a left ventricular wedge preparation during endocardial and epicardial stimulation (n = 5). The repolarization times were calculated from simultaneously recorded optical action potentials. QT, QT interval; Endo, subendocardial; Epi, subepicardial; T, T wave.
Figure 4
Figure 4
Relation between local repolarization and the T wave. (A, C, and E) A tracing of a pseudo-ECG (upper) recorded from a ventricular wedge preparation during endocardial stimulation along with simultaneously recorded optical action potentials (lower) from the subendocardium, subepicardium, basal, and apical myocardium during endocardial (A), epicardial (C), and endocardial/apical/bottom stimulation (E). (B, D, and F) Reconstructed activation (left) and repolarization (right) of the complete cut edge surface of a left ventricular wedge preparation during endocardial (B), epicardial (D), and endocardial/apical/bottom stimulation (F). Endo, subendocardial; Epi, subepicardial; T, T wave.
Figure 5
Figure 5
Simulation of the T wave recorded from left ventricular tissue preparation. (A) Action potentials at the endo, mid, and epicardium before simulation. The graphs show APD in the subendo and subepicardium of the tissue preparation during endocardial and epicardial stimulation in silico (B) and ex vivo (C). (D) The simulated activation sequence, action potential gradient, and repolarization pattern during endocardial point stimulation (D) in tissue slab representing the left ventricular tissue preparation. (E) The simulated pseudo-ECG during endocardial stimulation. (F) The potential distribution at t = 25 ms, t = 80 ms and t= 200 ms, t= 300 ms, and t = 350 ms during endocardial point stimulation. The numbers in the tissue slab indicate mV. (G) Action potentials at locations annotated in (F). Endo, subendocardial; Epi, subepicardial; T, time from onset activation.
Figure 6
Figure 6
Simulation of transmural repolarization patterns during epicardial point and endocardial line stimulation. (A) The simulated activation sequence, action potential gradient, and repolarization pattern during epicardial point (A) and endocardial line (C) stimulation in tissue slab representing the left ventricular tissue preparation. (B) The simulated pseudo-ECG recorded from the different stimulation locations (A) and (C). (D) A representative example of a body surface ECG recorded from a healthy human. Endo, subendocardial; Epi, subepicardial.

References

    1. Zhang L, Timothy KW, Vincent GM, Lehmann MH, Fox J, Giuli LC, Shen J, Splawski I, Priori SG, Compton SJ, Yanowitz F, Benhorin J, Moss AJ, Schwartz PJ, Robinson JL, Wang Q, Zareba W, Keating MT, Towbin JA, Napolitano C, Medina A. Spectrum of ST-T-wave patterns and repolarization parameters in congenital long-QT syndrome: ECG findings identify genotypes. Circulation 2000;102:2849–2855. - PubMed
    1. Franz MR, Bargheer K, Costard-Jackle A, Miller DC, Lichtlen PR. Human ventricular repolarization and T wave genesis. Prog Cardiovasc Dis 1991;33:369–384. - PubMed
    1. Glukhov AV, Fedorov VV, Lou Q, Ravikumar VK, Kalish PW, Schuessler RB, Moazami N, Efimov IR. Transmural dispersion of repolarization in failing and nonfailing human ventricle. Circ Res 2010;106:981–991. - PMC - PubMed
    1. Sicouri S, Antzelevitch C. A subpopulation of cells with unique electrophysiological properties in the deep subepicardium of the canine ventricle. The M Cell Circ Res 1991;68:1729–1741. - PubMed
    1. Drouin E, Charpentier F, Gauthier C, Laurent K, Le Marec H. Electrophysiologic characteristics of cells spanning the left ventricular wall of human heart: evidence for presence of M cells. J Am Coll Cardiol 1995;26:185–192. - PubMed

Publication types