. 2015 Nov;64(6):1018-31.
doi: 10.1093/sysbio/syv048. Epub 2015 Jul 23.

PoMo: An Allele Frequency-Based Approach for Species Tree Estimation

Affiliations

PoMo: An Allele Frequency-Based Approach for Species Tree Estimation

Nicola De Maio et al. Syst Biol. 2015 Nov.

Abstract

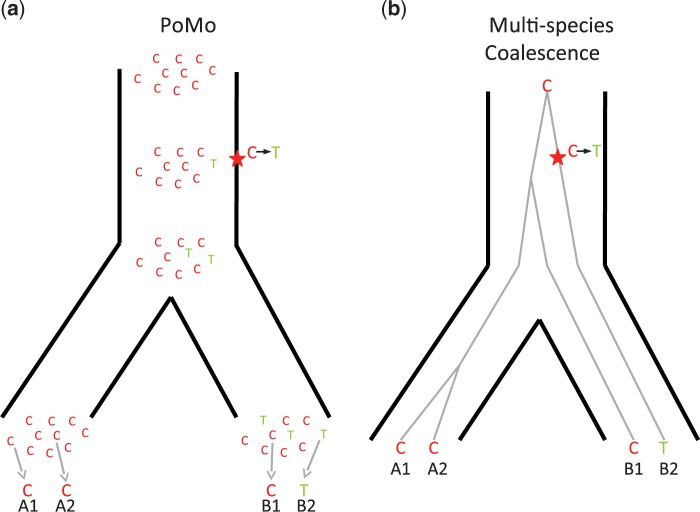
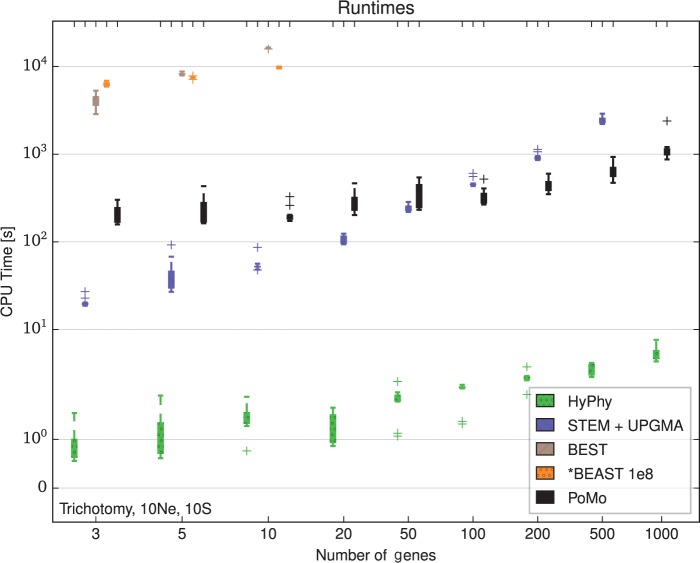
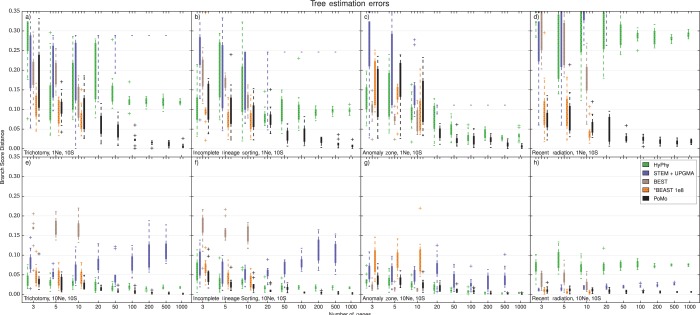
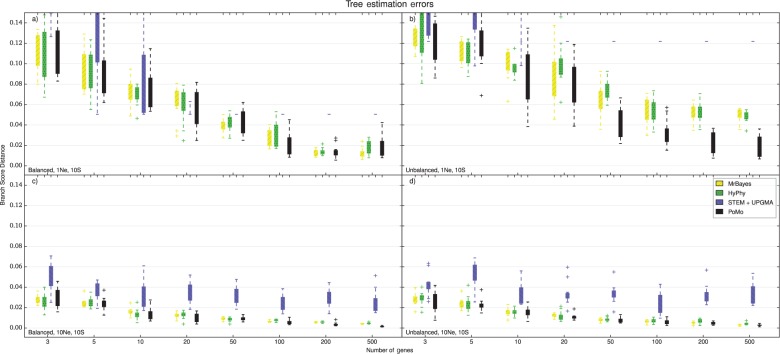
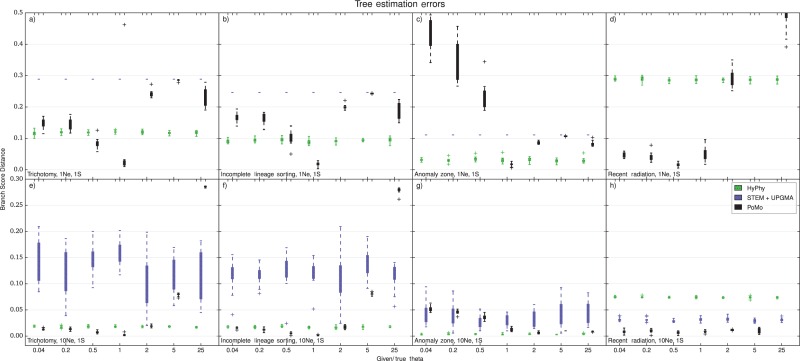
Incomplete lineage sorting can cause incongruencies of the overall species-level phylogenetic tree with the phylogenetic trees for individual genes or genomic segments. If these incongruencies are not accounted for, it is possible to incur several biases in species tree estimation. Here, we present a simple maximum likelihood approach that accounts for ancestral variation and incomplete lineage sorting. We use a POlymorphisms-aware phylogenetic MOdel (PoMo) that we have recently shown to efficiently estimate mutation rates and fixation biases from within and between-species variation data. We extend this model to perform efficient estimation of species trees. We test the performance of PoMo in several different scenarios of incomplete lineage sorting using simulations and compare it with existing methods both in accuracy and computational speed. In contrast to other approaches, our model does not use coalescent theory but is allele frequency based. We show that PoMo is well suited for genome-wide species tree estimation and that on such data it is more accurate than previous approaches.

Keywords: Incomplete lineage sorting; Phylogenetics; PoMo; Species tree.


Figures

Figure 1.
Figure 1.
Comparison of PoMo with the multispecies coalescent. Example of a phylogeny with two species, each with two sampled sequences per population (A1-A2 and B1-B2, respectively). A single alignment site is considered for simplicity, and the observed nucleotides are as depicted: C, C, C, T. a) In PoMo, observed nucleotides are modeled as sampled from 10 virtual individuals (gray arrows at the bottom). Mutations (stars in the figure) can introduce new alleles, and allele counts can change along branches due to drift, and be lost or fixed. The state history shown is only one of the many possible for the observed data. b) In the multispecies coalescent, the species tree (black thick lines) as well as gene trees (gray thin lines) are considered. Usually only the species tree parameters are of interest, and gene trees are nuisance parameters. One of the many possible unobserved gene trees is depicted as an example.
Figure 2.
Figure 2.
Species trees used in simulations. We chose trees that are well known for inference problems caused by incomplete lineage sorting. Each of the six trees shown is used in two scenarios: total tree height (T) is either set to 1Ne or to 10Ne generations, where Ne is the effective population size. L represents a short branch length of Ne/10 generations. Values not shown are determined by the strict molecular clock assumption. The scenario names are (i) trichotomy, (ii) classical ILS, (iii) balanced, (iv) anomalous, (v) recent radiation, and (vi) unbalanced.
Figure 3.
Figure 3.
Computational demands for different methods. Running times for estimation with 10 samples per species and tree height 10Ne generations in the trichotomy scenario. The Y axis shows the computational time in seconds, the X axis the number of genes included in the analysis. The colors represent different methods (see legend). Each boxplot includes 10 independent replicates. HyPhy applied to concatenated data is the fastest method. STEM estimates the ML species trees from a collection of gene trees provided by the user. We estimated the gene trees with the UPGMA and added the CPU times. For small data sets, PoMo and STEM + UPGMA have comparable computational demands. However, with more genes the CPU time for STEM + UPGMA increases roughly linearly with the number of genes while the time for PoMo remains almost constant. BEST and *BEAST were applied at most to 10 genes. MCMC steps (108) have been used for *BEAST. Our simulations suggest that methods such as *BEAST and BEST are not efficient enough to analyze large data sets.
Figure 4.
Figure 4.
Accuracy of species tree estimation, four-species-trees. We used BSD to compare the normalized simulated tree and the normalized estimated tree and to measure the error. BSD uses both topology and branch lengths to assess estimation accuracy, providing a broader picture than methods that use only the topology. Higher BSD values indicate larger inference errors. The Y axis is the error in species tree estimation calculated as BSD, the X axis is the number of genes included in the analysis. Four Species and 10 samples per species were included. Each boxplot includes 10 independent replicates. Different colors represent different methods (see legend). a) 1Ne tree height and scenario with trichotomy. b) 1Ne tree height and ILS scenario. c) 1Ne tree height and anomalous species tree. d) 1Ne tree height and recent population radiation. e) 10Ne tree height and trichotomy. f) 10Ne tree height and ILS scenario. g) 10Ne tree height and anomalous species tree. h) 10Ne tree height and recent population radiation. BEST and *BEAST were applied at most to 10 genes. MCMC steps (108) have been used for *BEAST. Note that the alternative methods are often inconsistent, that is, the error in tree estimation did not decrease as more data was added. PoMo shows accurate parameter estimates that converge toward the true values as more genes are included in the analysis in all scenarios.
Figure 5.
Figure 5.
Accuracy of species tree estimation, eight-species-trees. For larger trees, only PoMo, STEM + UPGMA, and concatenation with MrBayes or HyPhy could be used. Eight species and 10 samples per species were included. The Y axis is the error in species tree estimation calculated as BSD between the normalized simulated species tree and the normalized estimated tree, the X axis is the number of genes included in the analysis. Each boxplot includes 10 independent replicates. Different colors represent different methods (see legend). a) 1Ne tree height and balanced tree. b) 1Ne tree height and unbalanced tree. c) 10Ne tree height and balanced tree. d) 10Ne tree height and unbalanced tree. PoMo performs much better than STEM + UPGMA, and is slightly more accurate than the two concatenation approaches.
Figure 6.
Figure 6.
Errors in tree estimation with one sample per species, four-species-trees. When using one sample per species, a value for the within-species variability θ has to be specified by the user. The Y axis is the error in species tree estimation calculated as BSD between the normalized simulated species tree and the normalized estimated tree. The X axis is the ratio of the guessed input θ with the simulated one. Each boxplot includes 10 independent replicates. Different colors represent different methods (see legend). a) 1Ne tree height and scenario with trichotomy. b) 1Ne tree height and ILS scenario. c) 1Ne tree height and anomalous species tree. d) 1Ne tree height and recent population radiation. e) 10Ne tree height and trichotomy. f) 10Ne tree height and ILS. g) 10Ne tree height and anomalous species tree. h) 10Ne tree height and recent population radiation. The PoMo estimates are depending on the quality of the guess for θ. We therefore do not recommend to use PoMo in this situation.
Figure 7.
Figure 7.
Species tree estimation on the Great Ape data set. Phylogenies were inferred using a) PoMo and b) concatenation. Population names are abbreviated (Born: Bornean, Suma: Sumatran, East: Eastern, CrRi: Cross-River, West: Western, NonA: Non-African, Afri: African, Bono: Bonobos, Cent: Central, NiCa: Nigeria-Cameron. The numbers indicate the abundance of the different clade topologies among different runs (we performed a total of 10 runs per method). The PoMo trees are topologically more stable than the trees estimated from the concatenated data of one randomly chosen individual per species. Interpretation of phylogenetic scales differs between the two methods. In fact, state changes in concatenation represent substitutions, while in PoMo they represent mutation and drift.

Similar articles

Cited by

References

    1. Bentley D.R. 2006. Whole-genome re-sequencing. Curr. Opin. Genet. Dev. 16:545–552. - PubMed
    1. Boussau B., Szöllősi G.J., Duret L., Gouy M., Tannier E., Daubin V. 2013. Genome-scale coestimation of species and gene trees. Genome Res. 23:323–330. - PMC - PubMed
    1. Bryant D., Bouckaert R., Felsenstein J., Rosenberg N.A., RoyChoudhury A. 2012. Inferring species trees directly from biallelic genetic markers: bypassing gene trees in a full coalescent analysis. Mol. Bio. Evol. 29:1917–1932. - PMC - PubMed
    1. Carstens B.C., Knowles L.L. 2007. Estimating species phylogeny from gene-tree probabilities despite incomplete lineage sorting: an example from melanoplus grasshoppers. Syst Biol. 56:400–411. - PubMed
    1. De Maio N., Schlötterer C., Kosiol C. 2013. Linking great apes genome evolution across time scales using polymorphism-aware phylogenetic models. Mol. Biol. Evol. 30:2249–2262. - PMC - PubMed

Publication types