. 2015 Jul 25:9:41.
doi: 10.1186/s12918-015-0187-6.

Regulation of ERK-MAPK signaling in human epidermis

Affiliations

Regulation of ERK-MAPK signaling in human epidermis

Joseph Cursons et al. BMC Syst Biol. .

Abstract

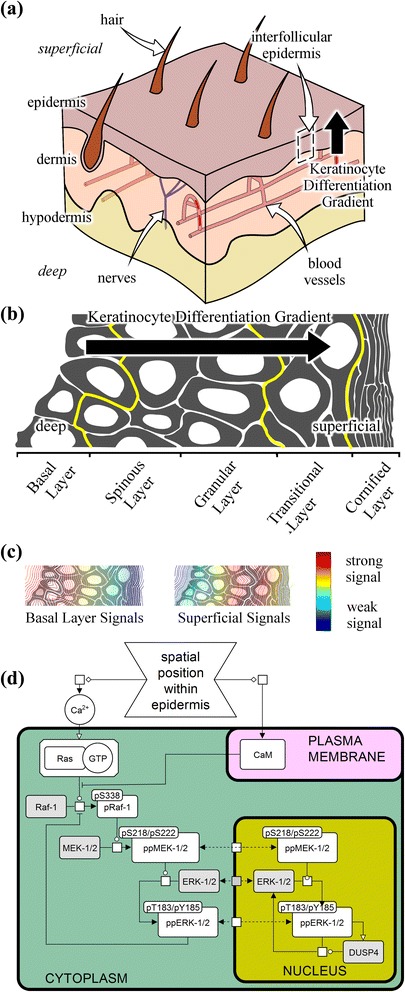
Background: The skin is largely comprised of keratinocytes within the interfollicular epidermis. Over approximately two weeks these cells differentiate and traverse the thickness of the skin. The stage of differentiation is therefore reflected in the positions of cells within the tissue, providing a convenient axis along which to study the signaling events that occur in situ during keratinocyte terminal differentiation, over this extended two-week timescale. The canonical ERK-MAPK signaling cascade (Raf-1, MEK-1/2 and ERK-1/2) has been implicated in controlling diverse cellular behaviors, including proliferation and differentiation. While the molecular interactions involved in signal transduction through this cascade have been well characterized in cell culture experiments, our understanding of how this sequence of events unfolds to determine cell fate within a homeostatic tissue environment has not been fully characterized.

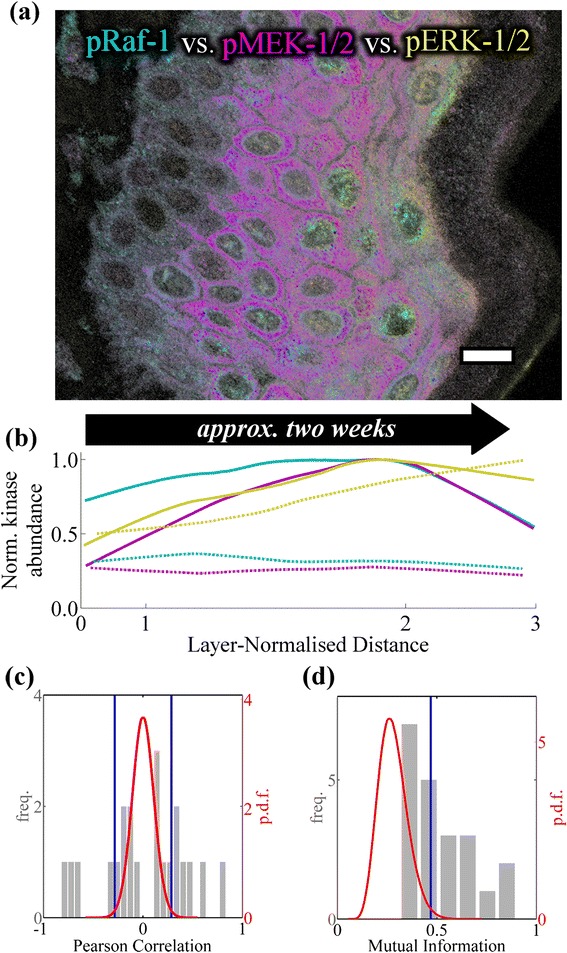
Methods: We measured the abundance of total and phosphorylated ERK-MAPK signaling proteins within interfollicular keratinocytes in transverse cross-sections of human epidermis using immunofluorescence microscopy. To investigate these data we developed a mathematical model of the signaling cascade using a normalized-Hill differential equation formalism.

Results: These data show coordinated variation in the abundance of phosphorylated ERK-MAPK components across the epidermis. Statistical analysis of these data shows that associations between phosphorylated ERK-MAPK components which correspond to canonical molecular interactions are dependent upon spatial position within the epidermis. The model demonstrates that the spatial profile of activation for ERK-MAPK signaling components across the epidermis may be maintained in a cell-autonomous fashion by an underlying spatial gradient in calcium signaling.

Conclusions: Our data demonstrate an extended phospho-protein profile of ERK-MAPK signaling cascade components across the epidermis in situ, and statistical associations in these data indicate canonical ERK-MAPK interactions underlie this spatial profile of ERK-MAPK activation. Using mathematical modelling we have demonstrated that spatially varying calcium signaling components across the epidermis may be sufficient to maintain the spatial profile of ERK-MAPK signaling cascade components in a cell-autonomous manner. These findings may have significant implications for the wide range of cancer drugs which therapeutically target ERK-MAPK signaling components.


Figures

Fig. 1
Fig. 1
ERK-MAPK Signaling Within Human Epidermis. a Epidermis is the outermost tissue layer of the skin with an essential role in protection from the environment. Epidermal barrier function is established and maintained by keratinocytes which undergo large biochemical and morphological changes during keratinocyte terminal differentiation. This establishes a spatially-regulated keratinocyte differentiation gradient across the depth of the epidermis, between hair follicles (within interfollicular epidermis). b Differentiating keratinocytes are pushed towards the superficial surface of the epidermis by proliferation within the basal layer. As this occurs, keratinocytes undergo terminal differentiation, establishing a spatiotemporal differentiation gradient across the depth of the epidermis. c The effect of tissue structure on paracrine/endocrine signals, and differentiation-associated changes in the abundance or activity of scaffold co-factors establish signal gradients across the depth of the epidermis. The gradient of Ca2+ within the epidermis is similar to the ‘superficial signals’ example; however, it peaks just prior to the transitional layer, rather than within the outermost superficial layers. d A simple representation of the canonical ERK-MAPK signaling cascade with: inputs to Raf-1 from extracellular calcium (Ca2+; activating) and plasma membrane calmodulin (CaM; inhibiting) modulated by cellular position along the keratinocyte differentiation gradient; the signal transduction cascade through Raf-1, MEK-1/2 and ERK-1/2; negative feedback from phospho-ERK-1/2 to phospho-Raf-1; and nuclear phospho-ERK-1/2 promoting its own dephosphorylation. Further details on these interactions are given within the Materials and methods. Nodes drawn in grey are not explicitly modeled, as they were not measured experimentally. A more comprehensive reaction kinetic scheme is given within Additional file 7: Figure S1 in reaction_network.png
Fig. 2
Fig. 2
Transforming fluorescence image data in to a spatially-conditioned, quantitative format for mathematical analysis. a Image data were obtained by immunofluorescence labeling and confocal microscopy, and different sub-cellular localizations (cytoplasm and nucleus) were manually sampled using a graphical user interface. The position and orientation of the cell selected for surface rendering (inset) has been highlighted (orange lines). b Epidermal tissue layers that could be distinguished using label-independent criteria were demarcated. The relative position of each sample was normalized within the layer using linear interpolation, then added to a whole integer which distinguished tissue layers (ilayer; Table 1), such that the normalized distance, dnorm = ilayer + (d1/(d1 + d2)). c The sampled fluorescence intensity data (grey dots) underwent loess smoothing (blue line). Spatial conditioning allowed data from Patients One (red), Two (green) and Three (blue) to be directly compared. d Protein abundance data from specific sub-cellular compartments were compared to a normalized-Hill differential equation model, with a literature derived network structure (described in Fig. 1d). This model was solved to steady-state at different spatial positions through the epidermis
Fig. 3
Fig. 3
Spatially coordinated changes to phosphorylated ERK-MAPK components within human epidermis. a Human epidermis simultaneously labeled against phospho-Raf-1 (pS338; cyan), phospho-MEK-1/2 (pS218/pS222; magenta) and phospho-ERK-1/2 (pT183/pY185; yellow). Scale bar represents 10 μm, image data have undergone non-linear transformation to improve printed appearance. b The normalized abundance of cytoplasmic (solid lines) and nuclear (dashed lines) phospho- Raf-1, −MEK-1/2, and ERK-1/2 (colors as above) within interfollicular keratinocytes undergoing terminal differentiation in situ. The c Pearson’s correlation and d mutual information were calculated between all pairwise combinations of target variables using the spatially-conditioned abundance data (grey histograms; axes at left). The strength of these statistical associations was compared to a null distribution calculated from spatially-scrambled data (red probability density function [p.d.f]; axes at right), which was used to calculate two-sided (Pearson’s correlation) and one-sided (mutual information) 99 % confidence intervals (blue vertical lines). For details on the strength of individual relationships please refer to Additional file 6: Table S1
Fig. 4
Fig. 4
Simulated and measured abundance profiles of species in our ERK-MAPK signaling model across human epidermis. Our model of the ERK-MAPK pathway is stimulated by: a normalized epidermal Ca2+ as derived by Mauro et al. [11]; and b plasma membrane CaM abundance as derived from our experimental data (Additional file 4: Figure S5i in CALM.png). At each spatial position, the model was run to steady-state with these inputs and c-g the simulated relative abundance of ERK-MAPK components is compared to our in situ experimental measurements. The y-axis in (a) has normalized units, and where experimental data is plotted (b-g), the y-axis represents the z-score of the immunofluorescence pixel intensities. The model input and output abundances were manually scaled to visually fit the experimental data by adjusting the baseline level and amplitude

References

    1. Candi E, Schmidt R, Melino G. The cornified envelope: a model of cell death in the skin. Nat Rev Mol Cell Biol. 2005;6:328–40. doi: 10.1038/nrm1619. - DOI - PubMed
    1. Lippens S, Denecker G, Ovaere P, Vandenabeele P, Declercq W. Death penalty for keratinocytes: apoptosis versus cornification. Cell Death Differ. 2005;12(Suppl 2):1497–508. doi: 10.1038/sj.cdd.4401722. - DOI - PubMed
    1. Adams JC, Watt FM. Fibronectin inhibits the terminal differentiation of human keratinocytes. Nature. 1989;340:307–9. doi: 10.1038/340307a0. - DOI - PubMed
    1. Fuchs E. Epidermal differentiation: the bare essentials. J Cell Biol. 1990;111:2807–14. doi: 10.1083/jcb.111.6.2807. - DOI - PMC - PubMed
    1. Eckert RL, Crish JF, Robinson NA. The epidermal keratinocyte as a model for the study of gene regulation and cell differentiation. Physiol Rev. 1997;77:397–424. - PubMed

Publication types

MeSH terms

Substances