. 2015 Oct;5(10):1086-97.
doi: 10.1158/2159-8290.CD-15-0120. Epub 2015 Jul 24.

Pancreatic Cancer Metastases Harbor Evidence of Polyclonality

Affiliations

Pancreatic Cancer Metastases Harbor Evidence of Polyclonality

Ravikanth Maddipati et al. Cancer Discov. 2015 Oct.

Abstract

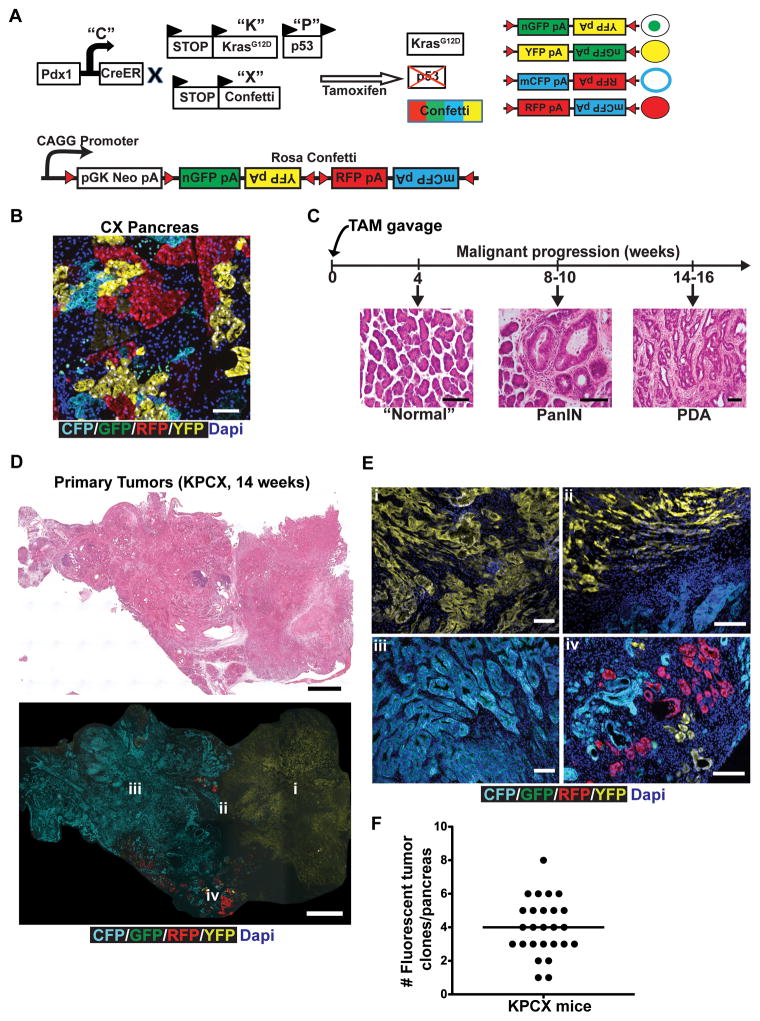
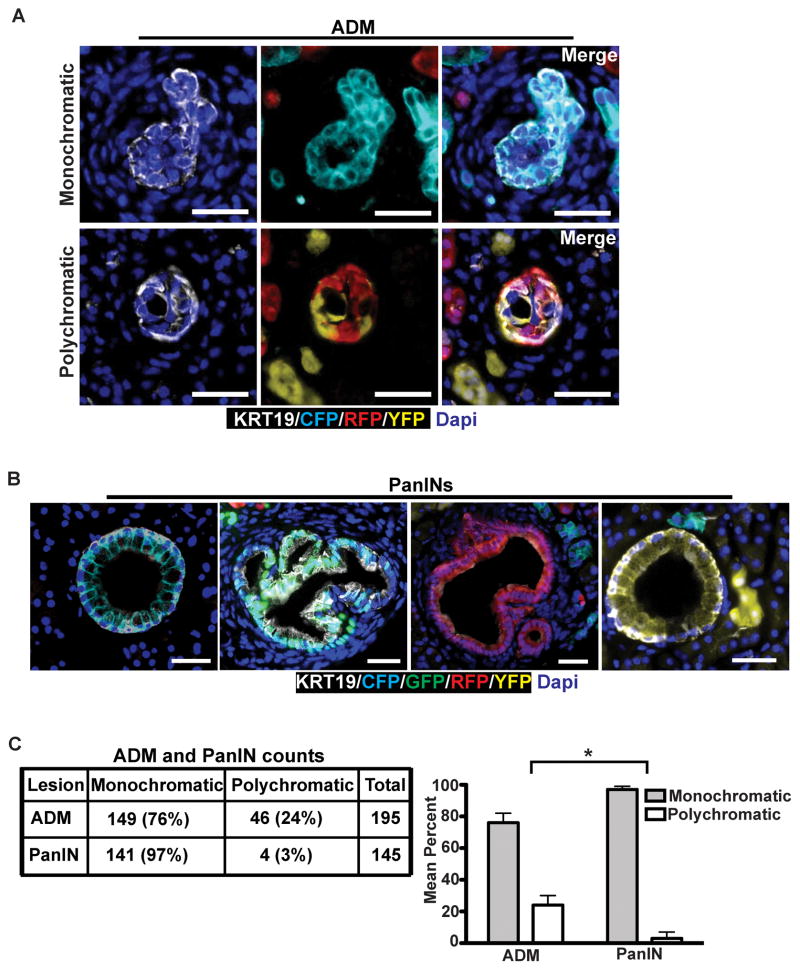
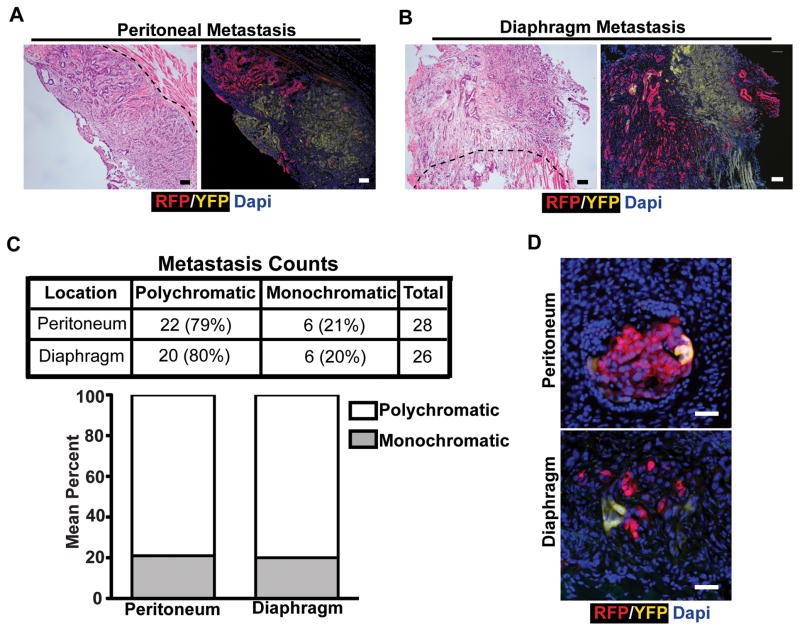
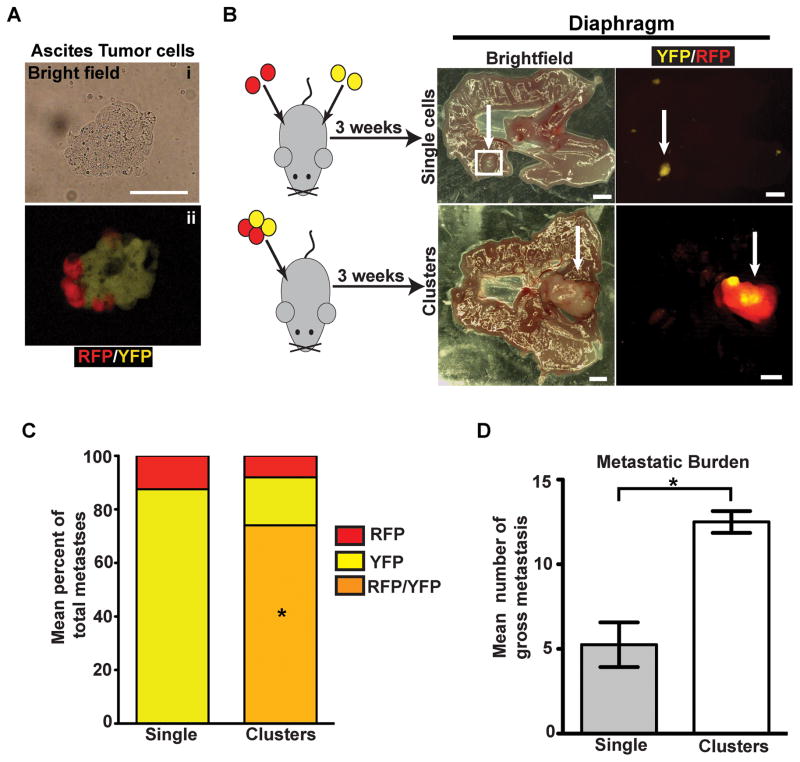
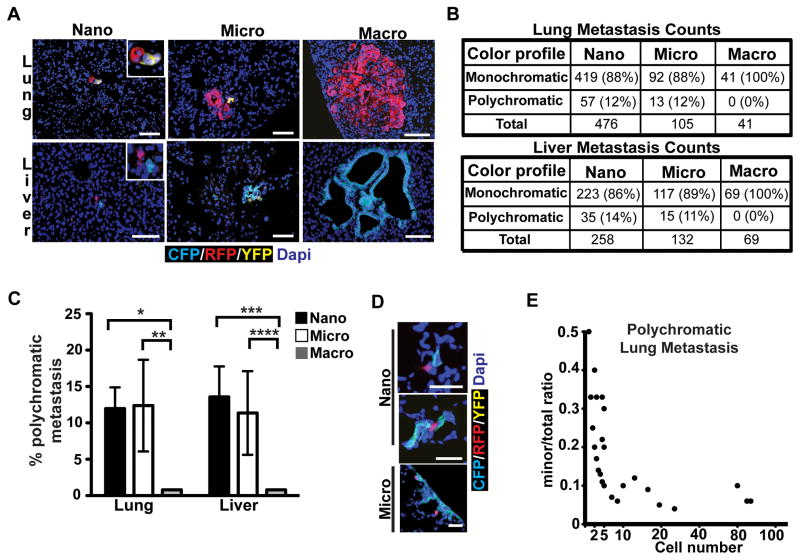
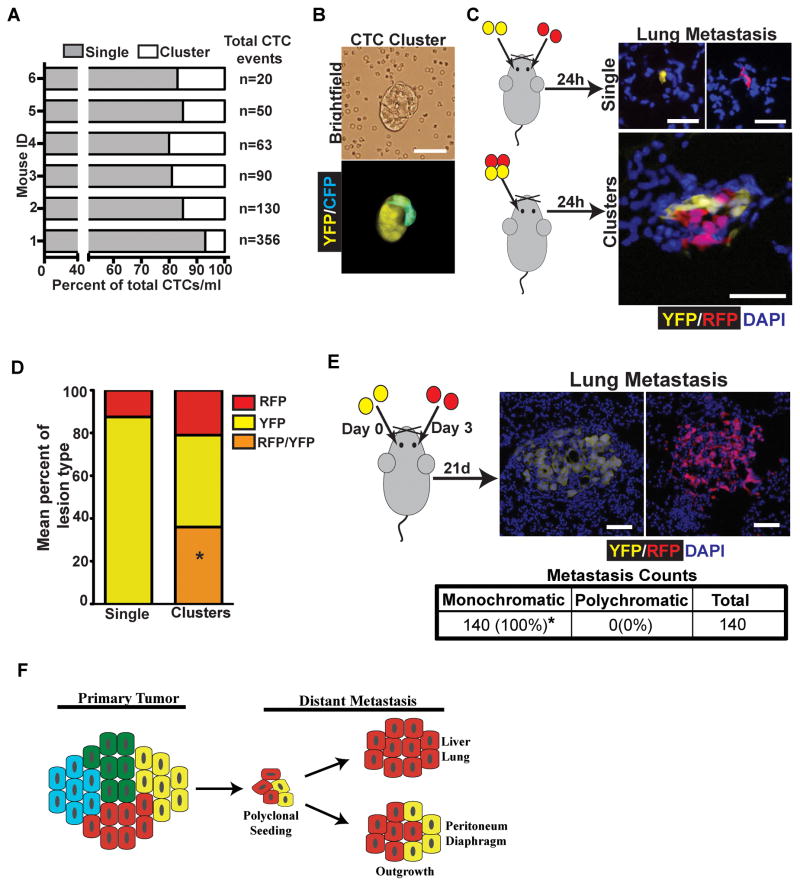
Studies of the cancer genome have demonstrated that tumors are composed of multiple subclones with varied genetic and phenotypic properties. However, little is known about how metastases arise and evolve from these subclones. To understand the cellular dynamics that drive metastasis, we used multicolor lineage-tracing technology in an autochthonous mouse model of pancreatic cancer. Here, we report that precursor lesions exhibit significant clonal heterogeneity but that this diversity decreases during premalignant progression. Furthermore, we present evidence that a significant fraction of metastases are polyclonally seeded by distinct tumor subclones. Finally, we show that clonality during metastatic growth-leading to either monoclonal or polyclonal expansion-differs based on the site of metastatic invasion. These results provide an unprecedented window into the cellular dynamics of tumor evolution and suggest that heterotypic interactions between tumor subpopulations contribute to metastatic progression in native tumors.

Significance: Studies of tumor heterogeneity indicate that distinct tumor subclones interact during cancer progression. Here, we demonstrate by lineage tracing that metastases often involve seeding by more than one clone and that subsequent cellular outgrowth depends on the metastatic site. These findings provide insight into clonal diversity and evolution in metastatic disease.


Conflict of interest statement

Conflict of Interest: The authors have no conflicts to disclose.

Figures

Figure 1
Figure 1. A multi-colored lineage-labeled model of pancreatic cancer
A, Schematic of the KPCX mouse model of pancreatic cancer used in this study, which employs the KrasG12D (“K”), p53fl/+ (“P”), Pdx1-CreER (“C”), and RosaConfetti (“X”) alleles. Tamoxifen inducible expression of the pancreas-specific Cre leads to expression of activated mutant KrasG12D, deletion of one allele of the p53 tumor suppressor, and recombination of the multi-color RosaConfetti Cre-reporter. Recombination of loxP sites within the Confetti locus results in labeling of pancreatic cells with one of 4 possible colors: nuclear GFP (green), cytoplasmic YFP (yellow), membrane CFP (cyan), and cytoplasmic RFP (red). B, Representative confocal fluorescent image of a section from a 10-week-old CX mouse pancreas depicting expression of the different RosaConfetti fluorescent labels. Labeling is principally seen in acinar cells, with negligible labeling of duct cells. C, H&E images of malignant progression in KPCX mice following tamoxifen (TAM) administration at birth. The pancreata of KPCX mice are initially normal but develop ADMs, PanINs, and PDAC with a reproducible time-course. D, Representative tile scan images of a cross-section through a KPCX pancreas. H&E staining (top panel) and fluorescence imaging (bottom panel) demonstrate the presence of two anatomically distinct monochromatic primary tumors within an apparent single pancreatic mass. E, Magnified fluorescent images from the tumor center (i, iii), periphery (iv) and border between adjacent clones (ii) of the pancreatic tumors depicted in D. F, A mean of 4 distinct monochromatic tumor lesions (as depicted in D, E) were found in each KPCX mouse (●). Data pooled from 26 tumor-bearing KPCX mice. Scale bars 100 μm for B, C, and E and 300μm for D.
Figure 2
Figure 2. Clonal selection occurs early in tumor progression
A and B, Fluorescent images of acinar-to-ductal metaplasia (ADM; A) and pancreatic intraepithelial neoplasia (PanIN; B) of 10 week-old KPCX mice. In A, ADMs are positive for the ductal maker Krt19 (white). Representative examples of monochromatic (top) or polychromatic (bottom) ADMs are shown. In B, representative images of monochromatic PanINs are shown. C, Quantification of monochromatic and polychromatic ADMs and PanINs in 10 week-old KPCX mice. Data were pooled from n=3 mice, and the total number of lesions counted is shown. The bar graph on the right shows the mean percentage of ADMs and PanINs in each group. Error bars represent 95% confidence intervals. * p<0.001 by Fisher’s exact test between lesion type in ADMs and PanINs. Scale bars 25 μm for A and 50μm for B.
Figure 3
Figure 3. Polyclonal metastasis is a frequent event in murine pancreatic cancer
A, Representative fluorescent images and H&E stains of adjacent sections depicting polychromatic metastasis in the peritoneum. B, Representative fluorescent images and H&E stains of adjacent sections depicting polychromatic metastasis in the diaphragm. C, Total counts and percentages of metastases in each site. Data pooled from n= 7 (peritoneum) and n=9 (diaphragm) 14–16 week old tumor-bearing KPCX mice. D, Fluorescent images of microscopic metastases from the peritoneal lining (top panel) and diaphragm (bottom panel). Scale bars 100 μm for A and B, and 25μm for D.
Figure 4
Figure 4. Polyclonal diaphragm metastases are seeded by polyclonal clusters
A, Bright field (i) and fluorescent images (ii) of a multi-colored cluster of disseminated tumor cells in the ascites. B, Intraperitoneal injection of 458d_R and 458d_Y cells (30,000) either as a suspension mixture of single cells (top panel) or multi-color clusters (bottom panel) into NOD.SCID mice. Images are paired brightfield (left panel) and fluorescent (right panel) stereomicroscope images from mice 3 weeks following injection with n=4 mice for each group. Monochromatic lesions are either YFP or RFP positive and polychromatic lesions are both YFP and RFP positive. C, Bar graph depicting mean percentage of total gross monochromatic (RFP or YFP only) or polychromatic (positive for both YFP and RFP) metastases between single cell and cluster injection groups. Data pooled from n=4 mice for each group (a total of 24 lesions were counted in the single cell group and 50 lesions were counted in the cluster group). No lesions from the single cell injection group were polychromatic. *p<0.001 by Fisher’s exact test comparing multi-color metastases between single cell and cluster injections. D, Bar graph depicting the mean number of gross metastases in the single cell and cluster injection groups (n=4 mice in each group). Error bars represent SEM. *p=0.0026 by Student’s t-test. Scale bars 25 μm for A and 1mm for B.
Figure 5
Figure 5. Clonal evolution during metastatic growth in lung and liver
A, Representative fluorescent images of metastases in lung (top panels) and liver (bottom panels). B, Quantification of monochromatic and polychromatic lesions in lung (top) and liver (bottom) binned according to lesion size (nano: 2–10 cells; micro: 11–100 cells; and macro: >100 cells). Percentages are relative to the total number of metastases counted for each size category. Data are pooled from n=6 (lung) and n=5 (liver) tumor-bearing animals. C, Bar graph depicting the data presented in B. Error bars represent 95% confidence intervals. *p=0.016, **p=0.02, ***p=0.0003, and ****p=0.0016 by Fisher’s exact test. D, Fluorescent images of bi-chromatic lung metastases depicting an increase in the ratio of the major component (CFP) relative to the minor component (RFP) as a function of lesion size. E, Curve showing the trend depicted in (C). The ratio of the number of cells in the minor fraction relative to the total number of fluorescent cells in a metastatic lesion (y-axis) is plotted as a function of the total fluorescent cell number in the lesion (x-axis). Each (●) represents a single lung metastasis. Data were taken from 63 individual lung metastases pooled from n=6 mice (lesions with identical ratios and size are represented as a single data point). p<0.0001 by Wald Chi-square test. Scale bars 50 μm for A and D
Figure 6
Figure 6. Polyclonal lung metastases are seeded by polyclonal CTC clusters
A, Bar graph depicting the mean percentage of single cell CTC and CTC cluster events per ml of blood in 6 individual KPCXY tumor-bearing mice. Total CTC events/ml are shown for each mouse are listed to the right of the graph. Percentage of CTC clusters ranged from 7–20%. B, Brightfield (top panel) and fluorescent (bottom panel) image of a multi-color CTC cluster isolated from the blood of a KPCXY mouse. C, Retro-orbital injection of 458d_R and 458d_Y cells (20,000) either as mixture of single cells (top panel) or multi-color clusters (bottom panel) into NOD.SCID mice. Right panels are representative fluorescent images of resulting metastatic lung lesions in the two injection groups. D, Quantification of the data in C. The mean percentage of monochromatic (RFP or YFP only) or polychromatic (positive for both RFP and YFP) metastases are indicated in stacked graph format for each injection group (single cell or cluster). Data are pooled from n=4 mice for each group (a total of 208 lesions were counted for the single cell group and 607 lesions were counted for the cluster group). *p<0.001 by Fisher’s exact test comparing the frequency of polychromatic metastases between single cell and cluster injections. E, Retro-orbital injection of 458d_R and 458d_Y cells as sequential injections of single cells into NOD.SCID mice separated by 3 days. Right panels are representative fluorescent images of lung metastatic lesions detectable 21 days later. Table shows total metastatic counts and the percentage of monochromatic and polychromatic lesions. Data pooled from n=4 mice. *p<0.001 by Fisher’s exact test. F, Model for the development of polyclonal metastases. Polyclonal cell clusters derived from the primary tumor give rise to polyclonal seeding events, followed by either monoclonal or multi-clonal outgrowth depending on tissue site. Scale bars 25 μm for B, C, and E.

References

    1. Hanahan D, Weinberg RA. Hallmarks of cancer: the next generation. Cell. 2011;144:646–74. - PubMed
    1. Greaves M, Maley CC. Clonal evolution in cancer. Nature. 2012;481:306–13. - PMC - PubMed
    1. Talmadge JE, Wolman SR, Fidler IJ. Evidence for the clonal origin of spontaneous metastases. Science. 1982;217:361–3. - PubMed
    1. Talmadge JE, Fidler IJ. AACR centennial series: the biology of cancer metastasis: historical perspective. Cancer research. 2010;70:5649–69. - PMC - PubMed
    1. Friedl P, Locker J, Sahai E, Segall JE. Classifying collective cancer cell invasion. Nat Cell Biol. 2012;14:777–83. - PubMed

Publication types

Substances