. 2015 Oct;81(19):6825-38.
doi: 10.1128/AEM.02221-15. Epub 2015 Jul 24.

Roles of Thermophiles and Fungi in Bitumen Degradation in Mostly Cold Oil Sands Outcrops

Affiliations

Roles of Thermophiles and Fungi in Bitumen Degradation in Mostly Cold Oil Sands Outcrops

Man-Ling Wong et al. Appl Environ Microbiol. 2015 Oct.

Abstract

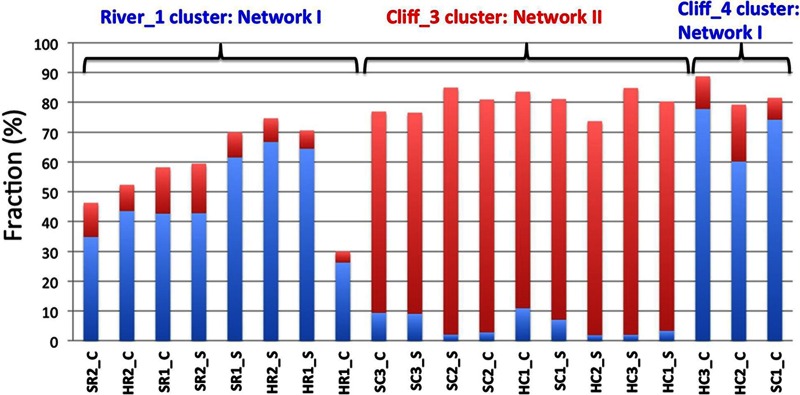
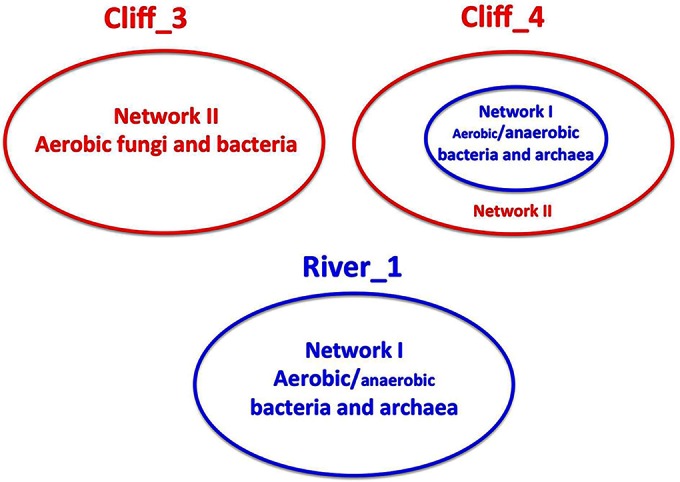
Oil sands are surface exposed in river valley outcrops in northeastern Alberta, where flat slabs (tablets) of weathered, bitumen-saturated sandstone can be retrieved from outcrop cliffs or from riverbeds. Although the average yearly surface temperature of this region is low (0.7°C), we found that the temperatures of the exposed surfaces of outcrop cliffs reached 55 to 60°C on sunny summer days, with daily maxima being 27 to 31°C. Analysis of the cooccurrence of taxa derived from pyrosequencing of 16S/18S rRNA genes indicated that an aerobic microbial network of fungi and hydrocarbon-, methane-, or acetate-oxidizing heterotrophic bacteria was present in all cliff tablets. Metagenomic analyses indicated an elevated presence of fungal cytochrome P450 monooxygenases in these samples. This network was distinct from the heterotrophic community found in riverbeds, which included fewer fungi. A subset of cliff tablets had a network of anaerobic and/or thermophilic taxa, including methanogens, Firmicutes, and Thermotogae, in the center. Long-term aerobic incubation of outcrop samples at 55°C gave a thermophilic microbial community. Analysis of residual bitumen with a Fourier transform ion cyclotron resonance mass spectrometer indicated that aerobic degradation proceeded at 55°C but not at 4°C. Little anaerobic degradation was observed. These results indicate that bitumen degradation on outcrop surfaces is a largely aerobic process with a minor anaerobic contribution and is catalyzed by a consortium of bacteria and fungi. Bitumen degradation is stimulated by periodic high temperatures on outcrop cliffs, which cause significant decreases in bitumen viscosity.


Figures

FIG 1
FIG 1
(A) Horse River outcrop near Fort McMurray, Alberta, showing the cliff and river below; (B and C) bituminous sandstone tablet retrieved from the cliff (B) and the river (C); (D) cross section of a tablet retrieved from the cliff; (E) natural oil contamination of Saline Creek near Fort McMurray, Alberta. Bars, approximately 1 m (foreground in panel A) and 10 cm (B to E).
FIG 2
FIG 2
Oil sands outcrop surface and air temperatures at a west-facing Saline Creek outcrop and a south-facing Horse River outcrop near Fort McMurray as a function of time recorded on 6 September 2011 and 7 September 2011, respectively. Error bars indicate the standard errors of three measurements and are smaller than the symbol, when not shown.
FIG 3
FIG 3
Analysis of pyrosequencing data for 16S/18S rRNA amplicon libraries from the oil sands outcrop samples listed in Tables 1 and 2. (A) Newick-formatted dendrogram of community compositions obtained using the UPGMA algorithm implemented in mothur indicating the four major clusters identified by red circles numbered 1 to 4 and referred to in the text as River_1, OC2007_2, Cliff_3, and Cliff_4, respectively. Mixed samples retrieved from the Horse River (HR_M) and the Horse River cliff (HC-M) were used for metagenome analysis and are indicated (formula image). The relative abundances of eukaryotic phyla (B), proteobacterial classes (C), and major phyla other than Proteobacteria (D) are also shown.
FIG 4
FIG 4
Survey of predominant taxa in amplicon libraries of field samples displayed in the same order as in the dendrogram shown in Fig. 3. Taxa are ranked according to the average fraction of pyrosequencing reads (in percent). Only taxa with an average fraction in excess of 0.5% are shown. Fractions in excess of 1% are color coded according to clusters defined in Fig. 3 (green, River_1 cluster; yellow, OC2007_2 cluster; purple, Cliff_3 cluster; blue, Cliff_4 cluster). The sum of the numbers in each column is the fraction of the amplicon library that is represented.
FIG 5
FIG 5
Compositions of networks I and II found by cooccurrence analysis of 44 orders in the amplicon libraries of oil sands samples (30). The nodes of the networks represent orders, whereas the edges (connections) indicate strong and significant correlations between nodes. The nodes and edges are mapped with different colors on the basis of the numbers of samples where orders (nodes) were detected and the degree of correlation, respectively. The orders Actinomycetales, Alteromonadales, Caulobacterales, and Planctomycetales did not show significant correlations with the indicated orders from the two networks.
FIG 6
FIG 6
Percent distribution of networks I (blue bars) and II (red bars) shown in Fig. 5 in outcrop tablets representing the River_1, Cliff_3, or Cliff_4 cluster, as indicated in Fig. 3. Data are presented for samples from the surface (which have an _S suffix) or from the center (which have a _C suffix) of each tablet.
FIG 7
FIG 7
FTICR-MS analysis of bitumen extracted from oxic incubations. The distributions of O1 (A), O2 (B), O3 (C), and O4 (D) heteroatom class compounds, likely representing alkylated alcohols (A), carboxylic acids (B), hydroxy-carboxylic acids (C), and dicarboxylic acids and/or dihydroxy-carboxylic acids (D), respectively, are shown. Compounds are sorted as groups of species with common double bond equivalents (DBEs), which are and plotted versus the fraction of the heteroatom class ion response of each DBE compound group (18, 40). The sum of intensities of all DBE groups of the heteroatom class was set equal to 1. The spectra shown are for extracts of the original bitumen and of residual bitumen after incubation for 4 months at 4°C (O4_1 and O4_2, respectively) or at 55°C (O55_1 and O55_2, respectively).
FIG 8
FIG 8
Schematic representation of microbial community compositions in outcrop bitumen tablets. The predominance of aerobic or anaerobic Bacteria and Archaea in cliff tablets is indicated by different font sizes.

References

    1. Masliyah J, Zhou Z, Xu Z, Czarnecki J, Hamza H. 2004. Understanding water-based bitumen extraction from Athabasca oil sands. Can J Chem Eng 82:628–654.
    1. Adams JJ, Larter SR, Bennett B, Huang H, Westrich J, van Kruisdijk C. 2013. The dynamic interplay of oil mixing, charge timing, and biodegradation in forming the Alberta oil sands: insights from geologic modeling and biogeochemistry, p 23–102. In Hein FJ, Leckie D, Larter S, Suter J (ed), Heavy-oil and oil-sand petroleum systems in Alberta and beyond. AAPG studies in geology 64. American Association of Petroleum Geologists, Tulsa, OK.
    1. Tozer R, Choi A, Pietras J, Tanasichuk D. 2014. Athabasca oil sands: mega-trap restoration and charge timing. AAPG Bull 98:429–447. doi:10.1306/08071313039. - DOI
    1. Larter S, Head I. 2014. Oil sands and heavy oil: origin and exploitation. Elements 10:277–284. doi:10.2113/gselements.10.4.277. - DOI
    1. Evans CR, Rogers MA, Bailey NJL. 1971. Evolution and alteration of petroleum in western Canada. Chem Geol 8:147–170. doi:10.1016/0009-2541(71)90002-7. - DOI

Publication types