

The MI bundle: enabling network and structural biology in genome visualization tools
- PMID: 26209801
- PMCID: PMC4817051
- DOI: 10.1093/bioinformatics/btv431
The MI bundle: enabling network and structural biology in genome visualization tools
Abstract
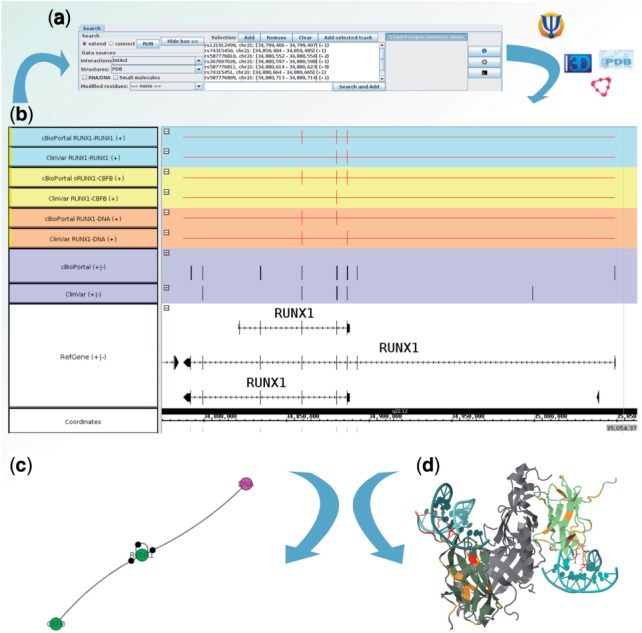
Prioritization of candidate genes emanating from large-scale screens requires integrated analyses at the genomics, molecular, network and structural biology levels. We have extended the Integrated Genome Browser (IGB) to facilitate these tasks. The graphical user interface greatly simplifies building disease networks and zooming in at atomic resolution to identify variations in molecular complexes that may affect molecular interactions in the context of genomic data. All results are summarized in genome tracks and can be visualized and analyzed at the transcript level.
Availability and implementation: The MI Bundle is a plugin for the IGB. The plugin, help, video and tutorial are available at http://cru.genomics.iit.it/igbmibundle/ and https://github.com/CRUiit/igb-mi-bundle/wiki. The source code is released under the Apache License, Version 2.
Contact: arnaud.ceol@iit.it
Supplementary information: Supplementary data are available at Bioinformatics online.
© The Author 2015. Published by Oxford University Press.
Figures
References
MeSH terms
Substances
LinkOut - more resources
Full Text Sources
Other Literature Sources
