

Timing of Cortico-Muscle Transmission During Active Movement
- PMID: 26209849
- PMCID: PMC4961012
- DOI: 10.1093/cercor/bhv151
Timing of Cortico-Muscle Transmission During Active Movement
Abstract
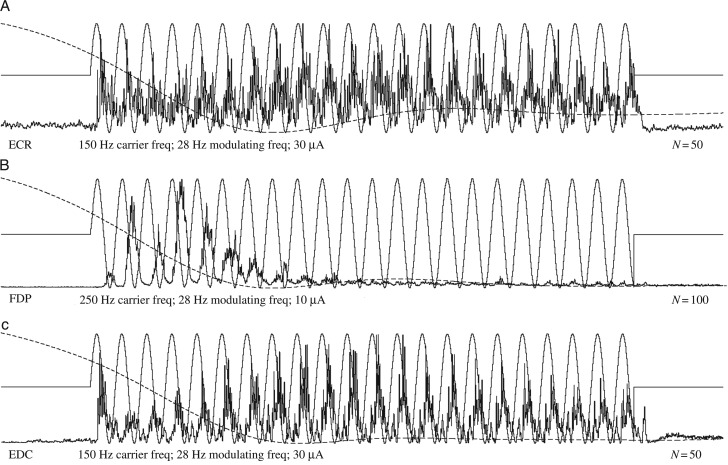
Numerous studies have reported large disparities between short cortico-muscle conduction latencies and long recorded delays between cortical firing and evoked muscle activity. Using methods such as spike- and stimulus-triggered averaging of electromyographic (EMG) activity, previous studies have shown that the time delay between corticomotoneuronal (CM) cell firing and onset of facilitation of forelimb muscle activity ranges from 6.7 to 9.8 ms, depending on the muscle group tested. In contrast, numerous studies have reported delays of 60-122 ms between cortical cell firing onset and either EMG or movement onset during motor tasks. To further investigate this disparity, we simulated rapid active movement by applying frequency-modulated stimulus trains to M1 cortical sites in a rhesus macaque performing a movement task. This yielded corresponding EMG modulations, the latency of which could be measured relative to the stimulus modulations. The overall mean delay from stimulus frequency modulation to EMG modulation was 11.5 ± 5.6 ms, matching closely the conduction time through the cortico-muscle pathway (12.6 ± 2.0 ms) derived from poststimulus facilitation peaks computed at the same sites. We conclude that, during active movement, the delay between modulated M1 cortical output and its impact on muscle activity approaches the physical cortico-muscle conduction time.
Keywords: EMG; cortico-muscle delay; forelimb; motor control; primary motor cortex.
Published by Oxford University Press 2015. This work is written by (a) US Government employee(s) and is in the public domain in the US.
Figures
Similar articles
-
Muscle synergies obtained from comprehensive mapping of the primary motor cortex forelimb representation using high-frequency, long-duration ICMS.J Neurophysiol. 2017 Jul 1;118(1):455-470. doi: 10.1152/jn.00784.2016. Epub 2017 Apr 26. J Neurophysiol. 2017. PMID: 28446586 Free PMC article.
-
Do corticomotoneuronal cells predict target muscle EMG activity?J Neurophysiol. 2008 Mar;99(3):1169-986. doi: 10.1152/jn.00906.2007. Epub 2007 Dec 26. J Neurophysiol. 2008. PMID: 18160426
-
Muscle Synergies Obtained from Comprehensive Mapping of the Cortical Forelimb Representation Using Stimulus Triggered Averaging of EMG Activity.J Neurosci. 2018 Oct 10;38(41):8759-8771. doi: 10.1523/JNEUROSCI.2519-17.2018. Epub 2018 Aug 27. J Neurosci. 2018. PMID: 30150363 Free PMC article.
-
Characteristics of corticomotoneuronal postspike facilitation and reciprocal suppression of EMG activity in the monkey.J Neurophysiol. 1985 Apr;53(4):959-78. doi: 10.1152/jn.1985.53.4.959. J Neurophysiol. 1985. PMID: 3998800
-
Representation of Muscle Synergies in the Primate Brain.J Neurosci. 2015 Sep 16;35(37):12615-24. doi: 10.1523/JNEUROSCI.4302-14.2015. J Neurosci. 2015. PMID: 26377453 Free PMC article. Review.
Cited by
-
Inferring Neural Communication Dynamics from Field Potentials Using Graph Diffusion Autoregression.bioRxiv [Preprint]. 2025 Jun 25:2024.02.26.582177. doi: 10.1101/2024.02.26.582177. bioRxiv. 2025. PMID: 38464147 Free PMC article. Preprint.
-
Quantifying neuro-motor correlations during awake deep brain stimulation surgery using markerless tracking.Sci Rep. 2022 Oct 27;12(1):18120. doi: 10.1038/s41598-022-21860-7. Sci Rep. 2022. PMID: 36302865 Free PMC article.
-
An Investigation of Manifold-Based Direct Control for a Brain-to-Body Neural Bypass.IEEE Open J Eng Med Biol. 2024 Mar 25;5:271-280. doi: 10.1109/OJEMB.2024.3381475. eCollection 2024. IEEE Open J Eng Med Biol. 2024. PMID: 38766541 Free PMC article.
-
Evidence of common and separate eye and hand accumulators underlying flexible eye-hand coordination.J Neurophysiol. 2017 Jan 1;117(1):348-364. doi: 10.1152/jn.00688.2016. Epub 2016 Oct 26. J Neurophysiol. 2017. PMID: 27784809 Free PMC article.
-
Water Intake and Handgrip Strength in US Adults: A Cross-Sectional Study Based on NHANES 2011-2014 Data.Nutrients. 2023 Oct 23;15(20):4477. doi: 10.3390/nu15204477. Nutrients. 2023. PMID: 37892552 Free PMC article.
References
-
- Baker SN, Lemon RN. 1998. Computer simulation of post-spike facilitation in spike-triggered averages of rectified EMG. J Neurophysiol. 80:1391–1406. - PubMed
-
- Binder MD, Heckman CJ, Powers RK. 2011. The physiological control of motoneuron activity. In: Rowell LB, Shepherd JT, editors. Handbook of Physiology. New York, NY: Oxford University Press. p. 3–53.
-
- Cheney PD, Fetz EE. 1980. Functional classes of primate corticomotoneuronal cells and their relation to active force. J Neurophysiol. 44:773–791. - PubMed
MeSH terms
LinkOut - more resources
Full Text Sources
Other Literature Sources
