

Nutrition Transition and the Global Diabetes Epidemic
- PMID: 26209940
- PMCID: PMC4942180
- DOI: 10.1007/s11892-015-0631-4
Nutrition Transition and the Global Diabetes Epidemic
Abstract
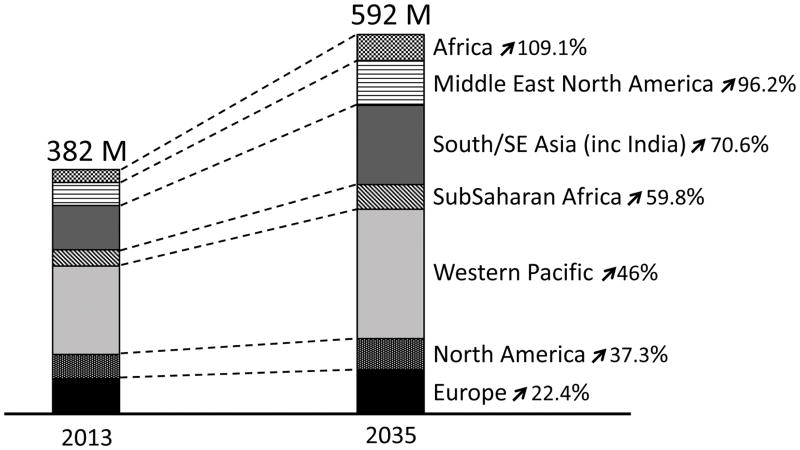
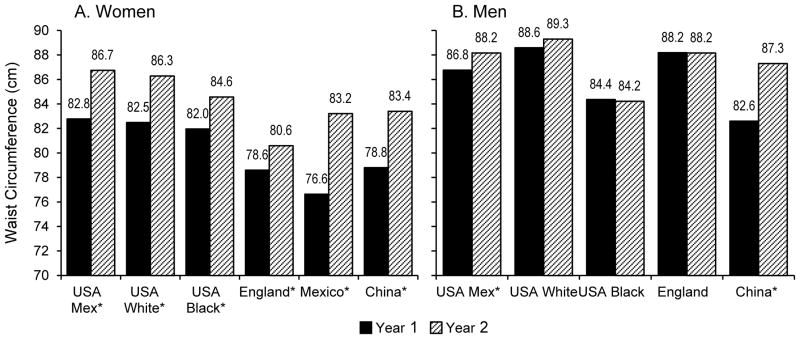
Low- and middle-income countries (LMICs) face a rapid change in the nutrition transition toward increases in noncommunicable diseases. Underlying this transition are shifts in the agricultural system and the subsequent growth of the modern retail and food service sectors across all regions and countries, a change in technology affecting physical activity and inactivity, mass media access, urbanization, and penetration of modern food systems into all societies. The resulting major shifts in diet are toward increased refined carbohydrates, added sweeteners, edible oils, and animal-source foods and reduced legumes, other vegetables, and fruits. Most countries are seeing increases in body mass index (BMI), overweight, and waist circumference (WC), and an increased WC-BMI ratio appears to be emerging in many regions. The implications of these rapidly changing diets and body compositions include the prevalence and severity of diabetes in LMICs.
Conflict of interest statement
Barry M. Popkin declares that he has no conflict of interest.
Figures
References
-
- Caballero B, Popkin BM. The nutrition transition: Diet and Disease in the Developing World. London: Academic Press; 2002.
-
- Popkin BM. The nutrition transition and its health implications in lower-income countries. Public Health Nutr. 1998;1(1):5–21. - PubMed
-
- Popkin BM. The shift in stages of the nutrition transition in the developing world differs from past experiences! Public Health Nutr. 2002;5(1A):205–14. - PubMed
-
- Popkin BM, Adair LS, Ng SW. Global nutrition transition and the pandemic of obesity in developing countries. Nutr Rev. 2012;70(1):3–21. doi: 10.1111/j.1753-4887.2011.00456.x. This is the author’s most recent detailed assessment of the overall shifts in diet, PA, and body composition and the developmental origins of health and disease. - DOI - PMC - PubMed
-
- Babu SC, Blom S. Building resilience for food and nutrition security. 2020 Conference Brief. 2014;6
Publication types
MeSH terms
Grants and funding
LinkOut - more resources
Full Text Sources
Other Literature Sources
Medical
