

Relative contributions of mercury bioavailability and microbial growth rate on net methylmercury production by anaerobic mixed cultures
- PMID: 26211614
- PMCID: PMC4782143
- DOI: 10.1039/c5em00174a
Relative contributions of mercury bioavailability and microbial growth rate on net methylmercury production by anaerobic mixed cultures
Abstract
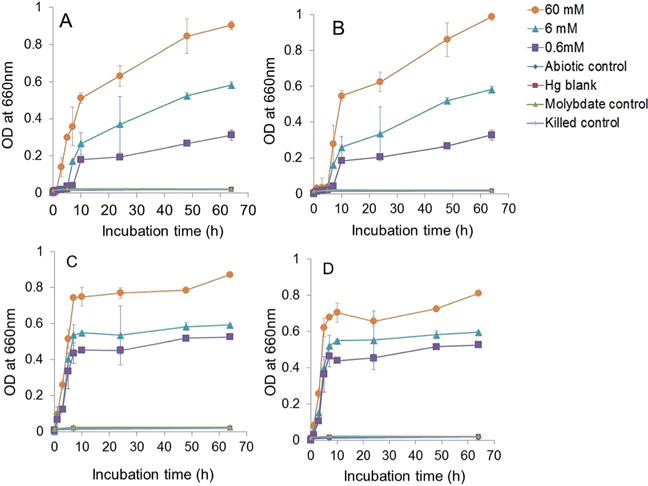
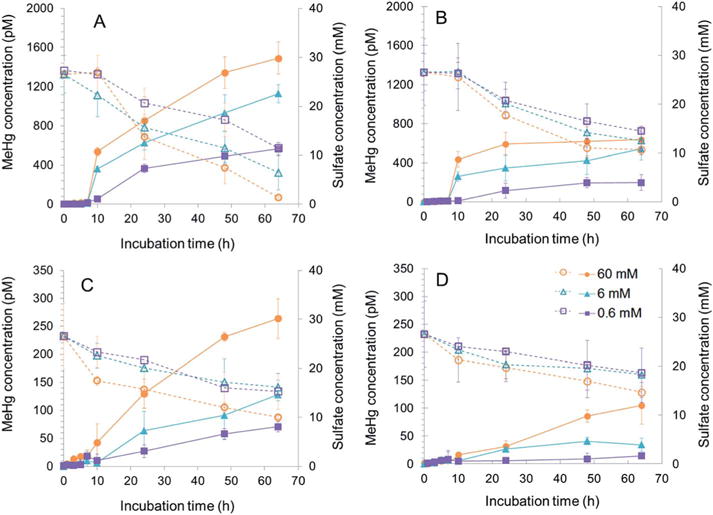
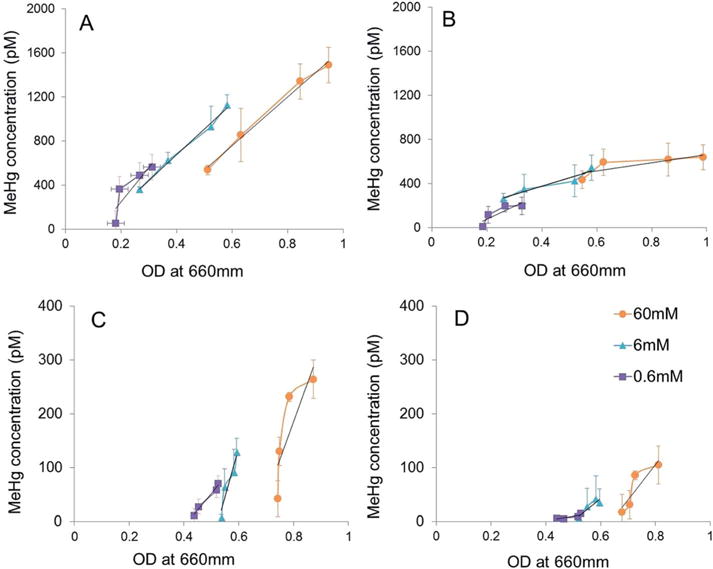
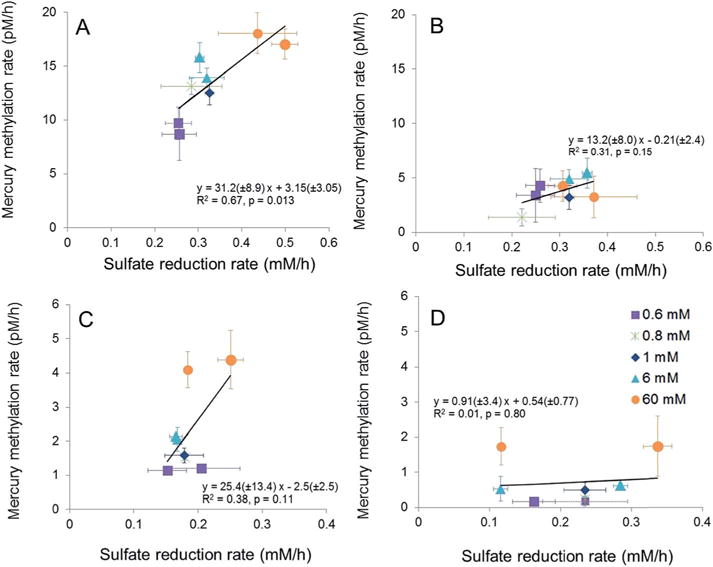
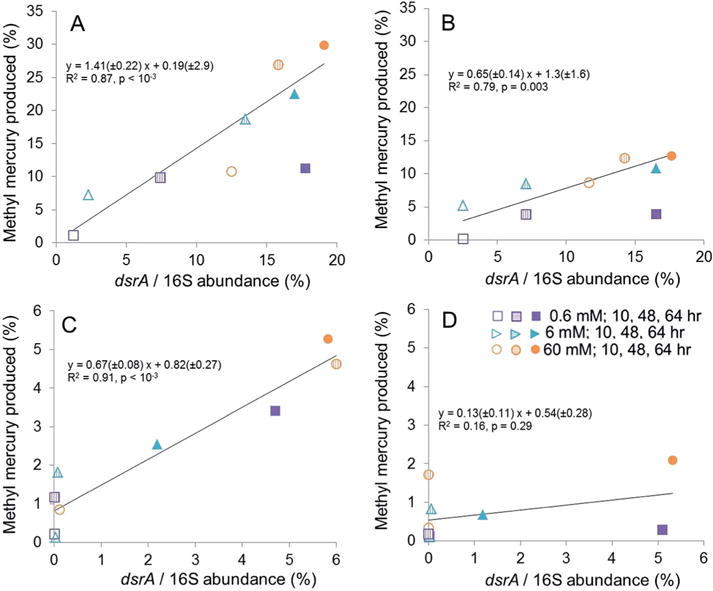
Monomethylmercury (MeHg) is produced in many aquatic environments by anaerobic microorganisms that take up and methylate inorganic forms of Hg(II). Net methylation of Hg(II) appears to be correlated with factors that affect the activity of the anaerobic microbial community and factors that increase the bioavailability of Hg(II) to these organisms. However, the relative importance of one versus the other is difficult to elucidate even though this information can greatly assist remediation efforts and risk assessments. Here, we investigated the effects of Hg speciation (dissolved Hg and nanoparticulate HgS) and microbial activity on the net production of MeHg using two mixed microbial cultures that were enriched from marine sediments under sulfate reducing conditions. The cultures were amended with dissolved Hg (added as a dissolved nitrate salt) and nanoparticulate HgS, and grown under different carbon substrate concentrations. The results indicated that net mercury methylation was the highest for cultures incubated in the greatest carbon substrate concentration (60 mM) compared to incubations with less carbon (0.6 and 6 mM), regardless of the form of mercury amended. Net MeHg production in cultures exposed to HgS nanoparticles was significantly slower than in cultures exposed to dissolved Hg; however, the difference diminished with slower growing cultures with low carbon addition (0.6 mM). The net Hg methylation rate was found to correlate with sulfate reduction rate in cultures exposed to dissolved Hg, while methylation rate was roughly constant for cultures exposed to nanoparticulate HgS. These results indicated a potential threshold of microbial productivity: below this point net MeHg production was limited by microbial activity, regardless of Hg bioavailability. Above this threshold of productivity, Hg speciation became a contributing factor towards net MeHg production.
Figures
Similar articles
-
Carbon Amendments Alter Microbial Community Structure and Net Mercury Methylation Potential in Sediments.Appl Environ Microbiol. 2018 Jan 17;84(3):e01049-17. doi: 10.1128/AEM.01049-17. Print 2018 Feb 1. Appl Environ Microbiol. 2018. PMID: 29150503 Free PMC article.
-
Net methylation of mercury in estuarine sediment microcosms amended with dissolved, nanoparticulate, and microparticulate mercuric sulfides.Environ Sci Technol. 2014 Aug 19;48(16):9133-41. doi: 10.1021/es500336j. Epub 2014 Jul 23. Environ Sci Technol. 2014. PMID: 25007388
-
Methylation of mercury by bacteria exposed to dissolved, nanoparticulate, and microparticulate mercuric sulfides.Environ Sci Technol. 2012 Jul 3;46(13):6950-8. doi: 10.1021/es203181m. Epub 2012 Jan 9. Environ Sci Technol. 2012. PMID: 22145980
-
Mechanisms regulating mercury bioavailability for methylating microorganisms in the aquatic environment: a critical review.Environ Sci Technol. 2013 Mar 19;47(6):2441-56. doi: 10.1021/es304370g. Epub 2013 Feb 27. Environ Sci Technol. 2013. PMID: 23384298 Review.
-
A review on mercury biogeochemistry in mangrove sediments: Hotspots of methylmercury production?Sci Total Environ. 2019 Aug 25;680:140-150. doi: 10.1016/j.scitotenv.2019.04.451. Epub 2019 May 8. Sci Total Environ. 2019. PMID: 31112813 Review.
Cited by
-
Enhanced availability of mercury bound to dissolved organic matter for methylation in marine sediments.Geochim Cosmochim Acta. 2016 Dec 1;194:153-162. doi: 10.1016/j.gca.2016.08.019. Epub 2016 Aug 26. Geochim Cosmochim Acta. 2016. PMID: 28127088 Free PMC article.
-
Co-culturing experiments reveal the uptake of myo-inositol phosphate synthase (EC 5.5.1.4) in an inositol auxotroph of Saccharomyces cerevisiae.Microb Cell Fact. 2021 Jul 19;20(1):138. doi: 10.1186/s12934-021-01610-6. Microb Cell Fact. 2021. PMID: 34281557 Free PMC article.
-
The Combined Effect of Hg(II) Speciation, Thiol Metabolism, and Cell Physiology on Methylmercury Formation by Geobacter sulfurreducens.Environ Sci Technol. 2023 May 9;57(18):7185-7195. doi: 10.1021/acs.est.3c00226. Epub 2023 Apr 25. Environ Sci Technol. 2023. PMID: 37098211 Free PMC article.
-
Carbon Amendments Alter Microbial Community Structure and Net Mercury Methylation Potential in Sediments.Appl Environ Microbiol. 2018 Jan 17;84(3):e01049-17. doi: 10.1128/AEM.01049-17. Print 2018 Feb 1. Appl Environ Microbiol. 2018. PMID: 29150503 Free PMC article.
-
Mercury in the Black Sea: New Insights From Measurements and Numerical Modeling.Global Biogeochem Cycles. 2018 Apr;32(4):529-550. doi: 10.1002/2017GB005700. Epub 2018 Apr 13. Global Biogeochem Cycles. 2018. PMID: 29861543 Free PMC article.
References
-
- Committee on the Toxicological Effects of Methylmercury, Board on Environmental Studies Toxicology and N. R. Council. The National Academies Press; 2000. - PubMed
-
- Mergler D, Anderson HA, Chan LHM, Mahaffey KR, Murray M, Sakamoto M, Stern AH. Ambio. 2007;36:3–11. - PubMed
-
- Hsu-Kim H, Kucharzyk KH, Zhang T, Deshusses MA. Environ Sci Technol. 2013;47:2441–2456. - PubMed
-
- Munthe J, Bodaly R, Branfireun BA, Driscoll CT, Gilmour CC, Harris R, Horvat M, Lucotte M, Malm O. Ambio. 2007;36:33–44. - PubMed
-
- Lin C-C, Yee N, Barkay T. Environmental Chemistry and Toxicology of Mercury. John Wiley & Sons, Inc; 2012. pp. 155–191.
Publication types
MeSH terms
Substances
Grants and funding
LinkOut - more resources
Full Text Sources
Other Literature Sources
Medical