

Measurement of the entrainment window of islets of Langerhans by microfluidic delivery of a chirped glucose waveform
- PMID: 26211670
- PMCID: PMC4558223
- DOI: 10.1039/c5ib00156k
Measurement of the entrainment window of islets of Langerhans by microfluidic delivery of a chirped glucose waveform
Abstract
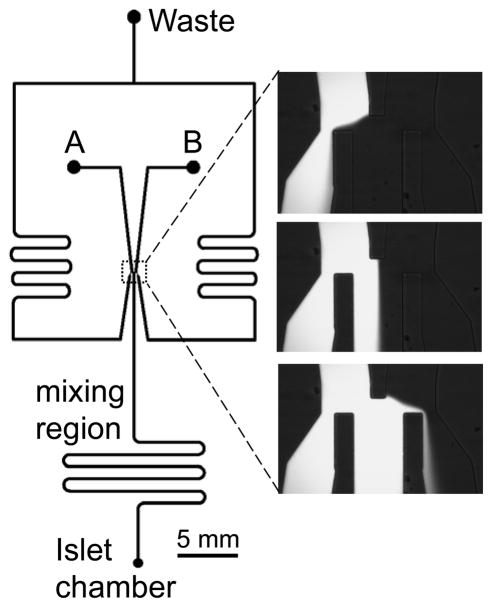
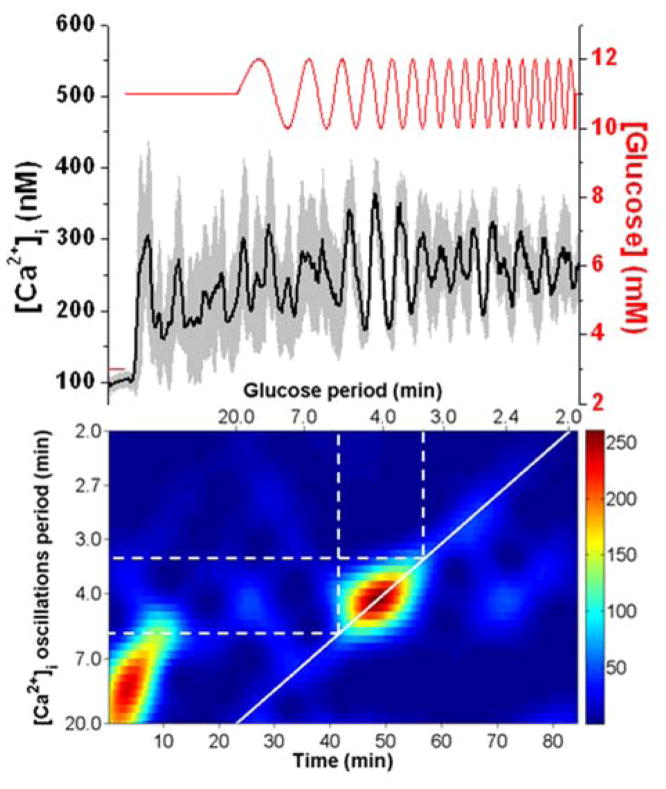
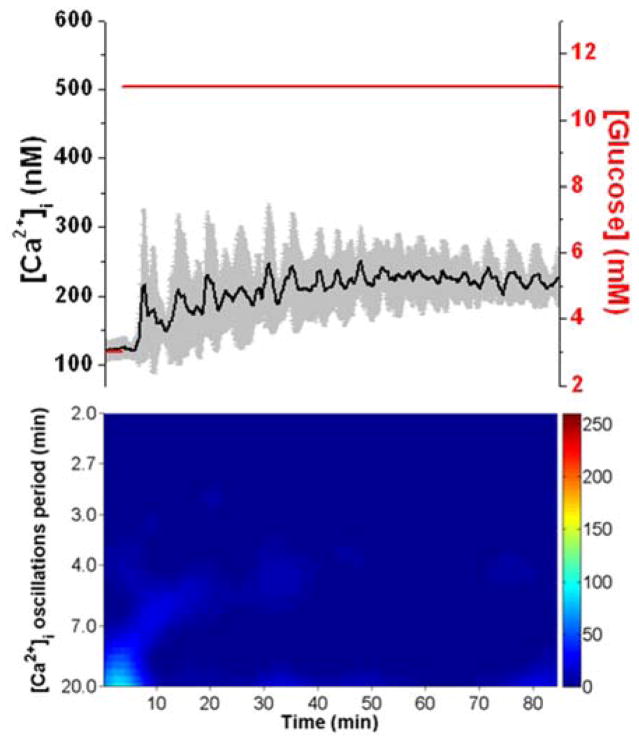
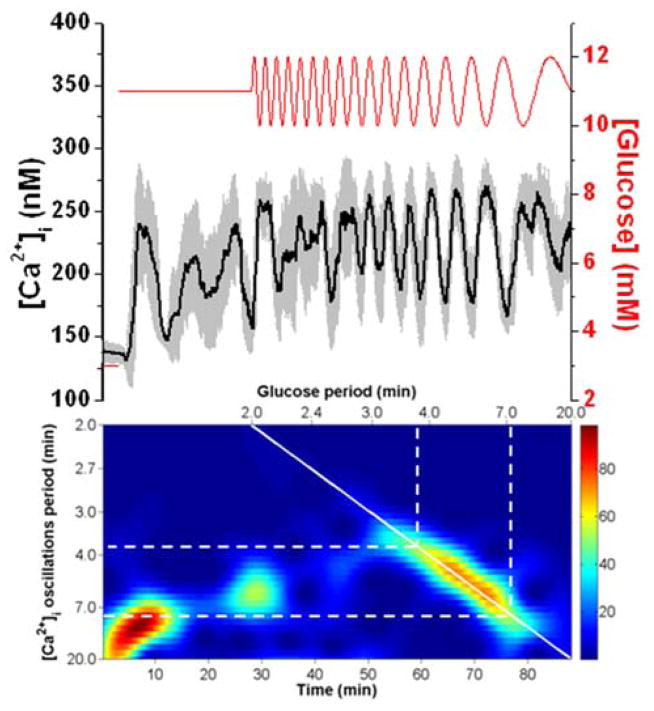
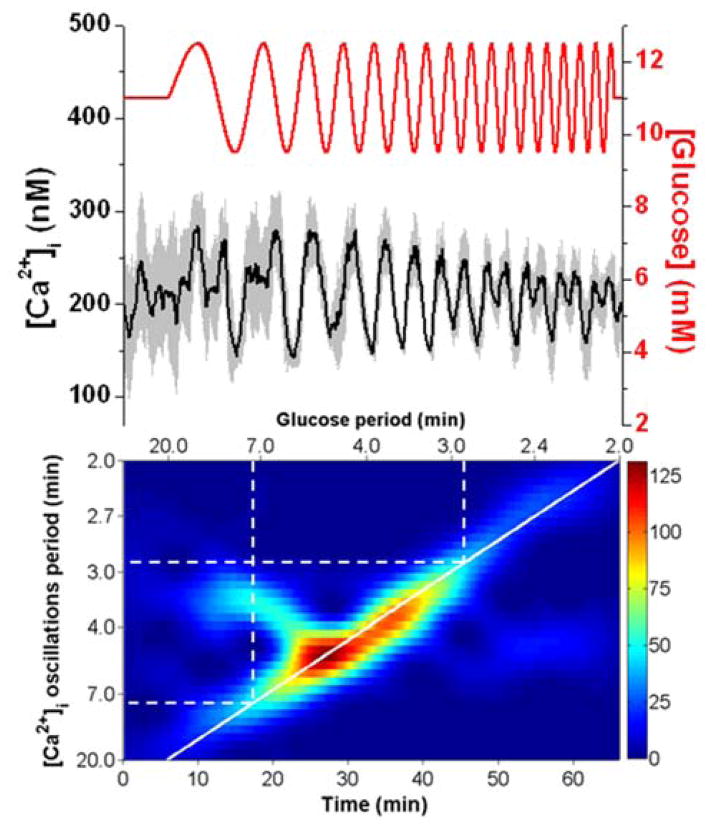
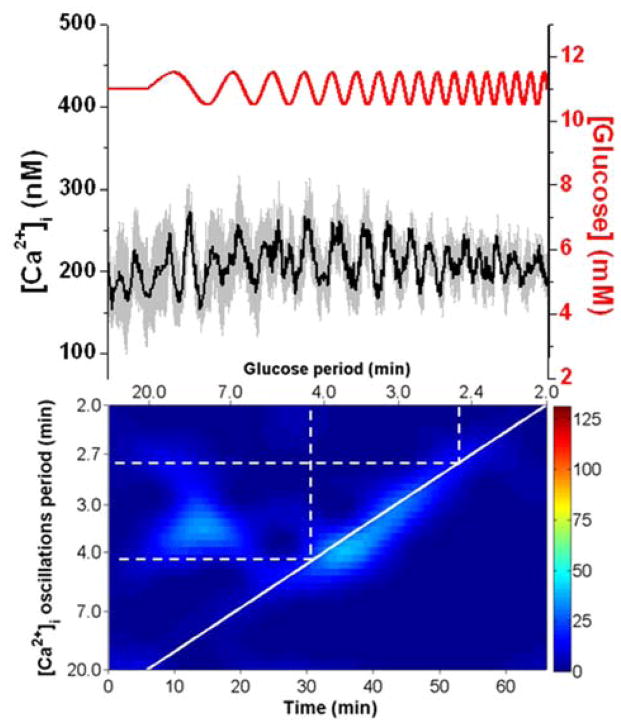
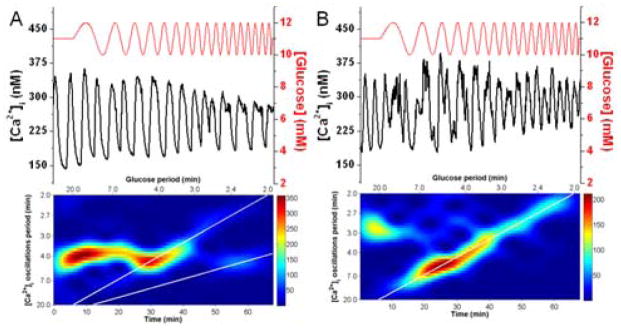
Within single islets of Langerhans, the endocrine portion of the pancreas, intracellular metabolites, as well as insulin secretion, oscillate with a period of ∼5 min. In vivo, pulsatile insulin oscillations are also observed with periods ranging from 5-15 minutes. In order for oscillations of insulin to be observed in vivo, the majority of islets in the pancreas must synchronize their output. It is known that populations of islets can be synchronized via entrainment of the individual islets to low amplitude glucose oscillations that have periods close to islets' natural period. However, the range of glucose periods and amplitudes that can entrain islets has not been rigorously examined. To find the range of glucose periods that can entrain islets, a microfluidic system was utilized to produce and deliver a chirped glucose waveform to populations of islets while their individual intracellular [Ca(2+)] ([Ca(2+)]i) oscillations were imaged. Waveforms with amplitudes of 0.5, 1, and 1.5 mM above a median value of 11 mM were applied while the period was swept from 20-2 min. Oscillations of [Ca(2+)]i resonated the strongest when the period of the glucose wave was within 2 min of the natural period of the islets, typically close to 5 min. Some examples of 1 : 2 and 2 : 1 entrainment were observed during exposure to long and short glucose periods, respectively. These results shed light on the dynamic nature of islet behavior and may help to understand dynamics observed in vivo.
Figures
Similar articles
-
Synchronization of mouse islets of Langerhans by glucose waveforms.Am J Physiol Endocrinol Metab. 2011 Oct;301(4):E742-7. doi: 10.1152/ajpendo.00248.2011. Epub 2011 Jul 19. Am J Physiol Endocrinol Metab. 2011. PMID: 21771970 Free PMC article.
-
Integrated perfusion and separation systems for entrainment of insulin secretion from islets of Langerhans.Lab Chip. 2015 Feb 7;15(3):823-32. doi: 10.1039/c4lc01360c. Lab Chip. 2015. PMID: 25474044 Free PMC article.
-
Glucose Oscillations Can Activate an Endogenous Oscillator in Pancreatic Islets.PLoS Comput Biol. 2016 Oct 27;12(10):e1005143. doi: 10.1371/journal.pcbi.1005143. eCollection 2016 Oct. PLoS Comput Biol. 2016. PMID: 27788129 Free PMC article.
-
Metabolic and electrical oscillations: partners in controlling pulsatile insulin secretion.Am J Physiol Endocrinol Metab. 2007 Oct;293(4):E890-900. doi: 10.1152/ajpendo.00359.2007. Epub 2007 Jul 31. Am J Physiol Endocrinol Metab. 2007. PMID: 17666486 Review.
-
Temporal profiles and clinical significance of pulsatile insulin secretion.Horm Res. 1998;49(3-4):178-84. doi: 10.1159/000023168. Horm Res. 1998. PMID: 9550122 Review.
Cited by
-
New insights into mammalian signaling pathways using microfluidic pulsatile inputs and mathematical modeling.Integr Biol (Camb). 2017 Jan 23;9(1):6-21. doi: 10.1039/c6ib00178e. Integr Biol (Camb). 2017. PMID: 27868126 Free PMC article. Review.
-
Rapid lipolytic oscillations in ex vivo adipose tissue explants revealed through microfluidic droplet sampling at high temporal resolution.Lab Chip. 2020 Apr 21;20(8):1503-1512. doi: 10.1039/d0lc00103a. Epub 2020 Apr 2. Lab Chip. 2020. PMID: 32239045 Free PMC article.
-
Insulin modulates the frequency of Ca2+ oscillations in mouse pancreatic islets.PLoS One. 2017 Aug 28;12(8):e0183569. doi: 10.1371/journal.pone.0183569. eCollection 2017. PLoS One. 2017. PMID: 28846705 Free PMC article.
-
Synchronization of pancreatic islets by periodic or non-periodic muscarinic agonist pulse trains.PLoS One. 2019 Feb 6;14(2):e0211832. doi: 10.1371/journal.pone.0211832. eCollection 2019. PLoS One. 2019. PMID: 30726280 Free PMC article.
-
Unveiling islet heterogeneity using an automated microfluidic imaging system.Sci Rep. 2024 Oct 21;14(1):24707. doi: 10.1038/s41598-024-75340-1. Sci Rep. 2024. PMID: 39433829 Free PMC article.
References
-
- Newsholme P, Gaudel C, McClenaghan NH. Adv Exp Med Biol. 2010;654:91–114. - PubMed
-
- Longo EA, Tornheim K, Deeney JT, Varnum BA, Tillotson D, Prentki M, Corkey BE. J Biol Chem. 1991;266:9314–9319. - PubMed
-
- Gilon P, Shepherd RM, Henquin JC. J Biol Chem. 1993;268:22265–22268. - PubMed
-
- Kennedy RT, Kauri LM, Dahlgren GM, Jung SK. Diabetes. 2002;(Suppl 1):S152–161. - PubMed
Publication types
MeSH terms
Substances
Grants and funding
LinkOut - more resources
Full Text Sources
Other Literature Sources
Miscellaneous
