

Coupled disease-behavior dynamics on complex networks: A review
- PMID: 26211717
- PMCID: PMC7105224
- DOI: 10.1016/j.plrev.2015.07.006
Coupled disease-behavior dynamics on complex networks: A review
Abstract
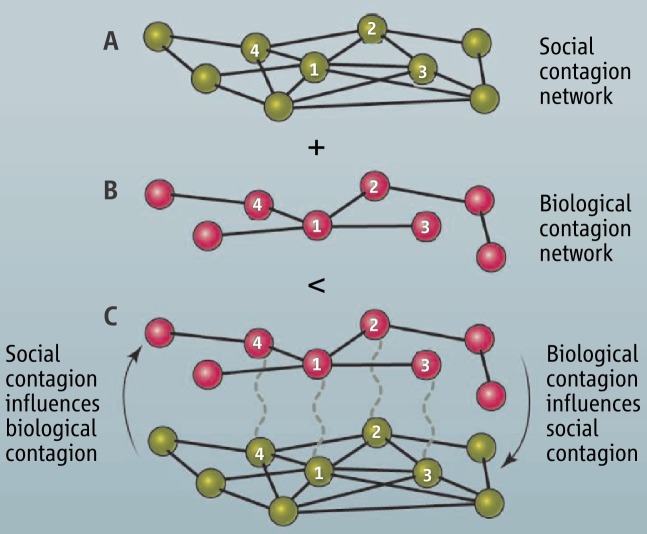
It is increasingly recognized that a key component of successful infection control efforts is understanding the complex, two-way interaction between disease dynamics and human behavioral and social dynamics. Human behavior such as contact precautions and social distancing clearly influence disease prevalence, but disease prevalence can in turn alter human behavior, forming a coupled, nonlinear system. Moreover, in many cases, the spatial structure of the population cannot be ignored, such that social and behavioral processes and/or transmission of infection must be represented with complex networks. Research on studying coupled disease-behavior dynamics in complex networks in particular is growing rapidly, and frequently makes use of analysis methods and concepts from statistical physics. Here, we review some of the growing literature in this area. We contrast network-based approaches to homogeneous-mixing approaches, point out how their predictions differ, and describe the rich and often surprising behavior of disease-behavior dynamics on complex networks, and compare them to processes in statistical physics. We discuss how these models can capture the dynamics that characterize many real-world scenarios, thereby suggesting ways that policy makers can better design effective prevention strategies. We also describe the growing sources of digital data that are facilitating research in this area. Finally, we suggest pitfalls which might be faced by researchers in the field, and we suggest several ways in which the field could move forward in the coming years.
Keywords: Decision-making; Disease–behavior dynamics; Networks; Social distancing; Vaccination.
Copyright © 2015 Elsevier B.V. All rights reserved.
Figures
Comment in
-
How to identify the most effective control measures based on disease-behavior coupled mechanisms?: Comment on "Coupled disease-behavior dynamics on complex networks: A review" by Z. Wang et al.Phys Life Rev. 2015 Dec;15:30-1. doi: 10.1016/j.plrev.2015.08.002. Epub 2015 Aug 31. Phys Life Rev. 2015. PMID: 26338110 No abstract available.
-
The friendship paradox as a strategy for scenarios with incomplete network data: Comment on "Coupled disease-behavior dynamics on complex networks: A review" by Z. Wang et al.Phys Life Rev. 2015 Dec;15:39-40. doi: 10.1016/j.plrev.2015.09.004. Epub 2015 Oct 9. Phys Life Rev. 2015. PMID: 26454707 No abstract available.
-
Scaling up complexity in host-pathogens interaction models: Comment on "Coupled disease-behavior dynamics on complex networks: A review" by Z. Wang et al.Phys Life Rev. 2015 Dec;15:41-2. doi: 10.1016/j.plrev.2015.09.007. Epub 2015 Oct 9. Phys Life Rev. 2015. PMID: 26454708 No abstract available.
-
Dynamically rich, yet parameter-sparse models for spatial epidemiology: Comment on "Coupled disease-behavior dynamics on complex networks: A review" by Z. Wang et al.Phys Life Rev. 2015 Dec;15:43-6. doi: 10.1016/j.plrev.2015.09.006. Epub 2015 Oct 9. Phys Life Rev. 2015. PMID: 26454709 No abstract available.
-
The role of complex networks in behavior epidemiology: Comment on "Coupled disease-behavior dynamics on complex networks: A review" by Z. Wang et al.Phys Life Rev. 2015 Dec;15:53-4. doi: 10.1016/j.plrev.2015.10.001. Epub 2015 Oct 9. Phys Life Rev. 2015. PMID: 26456725 No abstract available.
-
How to analytically characterize the epidemic threshold within the coupled disease-behavior systems?: Comment on "Coupled disease-behavior dynamics on complex networks: A review" by Z. Wang et al.Phys Life Rev. 2015 Dec;15:32-4. doi: 10.1016/j.plrev.2015.10.003. Epub 2015 Oct 9. Phys Life Rev. 2015. PMID: 26471701 No abstract available.
-
The importance of accurately modelling human interactions: Comment on "Coupled disease-behavior dynamics on complex networks: A review" by Z. Wang et al.Phys Life Rev. 2015 Dec;15:51-2. doi: 10.1016/j.plrev.2015.10.005. Epub 2015 Oct 20. Phys Life Rev. 2015. PMID: 26500162 No abstract available.
-
Public health impact of disease-behavior dynamics: Comment on "Coupled disease-behavior dynamics on complex networks: A review" by Z. Wang et al.Phys Life Rev. 2015 Dec;15:55-6. doi: 10.1016/j.plrev.2015.10.013. Epub 2015 Oct 19. Phys Life Rev. 2015. PMID: 26514411 Free PMC article. No abstract available.
-
Connecting human behavior and infectious disease spreading: Comment on "Coupled disease-behavior dynamics on complex networks: A review" by Wang et al.Phys Life Rev. 2015 Dec;15:47-8. doi: 10.1016/j.plrev.2015.10.014. Epub 2015 Oct 21. Phys Life Rev. 2015. PMID: 26521049 No abstract available.
-
Spatial coupled disease-behavior framework as a dynamic and adaptive system Reply to comments on "Coupled disease-behavior dynamics on complex networks: A review".Phys Life Rev. 2015 Dec;15:57-60. doi: 10.1016/j.plrev.2015.11.002. Epub 2015 Nov 12. Phys Life Rev. 2015. PMID: 26596994 No abstract available.
-
The impact of information spreading on disease dynamics: Comment on "Coupled disease-behavior on complex networks: A review" by Z. Wang et al.Phys Life Rev. 2015 Dec;15:37-8. doi: 10.1016/j.plrev.2015.10.010. Epub 2015 Oct 22. Phys Life Rev. 2015. PMID: 26603757 No abstract available.
-
Modelling real disease dynamics with behaviourally adaptive complex networks: Comment on "Coupled disease-behavior dynamics on complex networks: A review" by Z. Wang et al.Phys Life Rev. 2015 Dec;15:49-50. doi: 10.1016/j.plrev.2015.10.012. Epub 2015 Oct 22. Phys Life Rev. 2015. PMID: 26603767 No abstract available.
-
Simple deterministic models and applications: Comment on "Coupled disease-behavior dynamics on complex networks: A review" by Z. Wang et al.Phys Life Rev. 2015 Dec;15:35-6. doi: 10.1016/j.plrev.2015.08.001. Epub 2015 Aug 29. Phys Life Rev. 2015. PMID: 26657645 No abstract available.
References
-
- Twigg G. Batsford Academic and Educational; 1984. The black death: a biological reappraisal.
-
- World Health Organization . World Health Organization; 1996. The world health report 1996: fighting disease; fostering development. - PubMed
-
- Hethcote H.W. The mathematics of infectious diseases. SIAM Rev. 2000;42(4):599–653.
-
- von Neumann J., Morgenstern O. Princeton University Press; Princeton, NJ: 1944. Theory of games and economic behaviour.
Publication types
MeSH terms
LinkOut - more resources
Full Text Sources
Other Literature Sources
