

Hdac3 Deficiency Increases Marrow Adiposity and Induces Lipid Storage and Glucocorticoid Metabolism in Osteochondroprogenitor Cells
- PMID: 26211746
- PMCID: PMC4758691
- DOI: 10.1002/jbmr.2602
Hdac3 Deficiency Increases Marrow Adiposity and Induces Lipid Storage and Glucocorticoid Metabolism in Osteochondroprogenitor Cells
Abstract
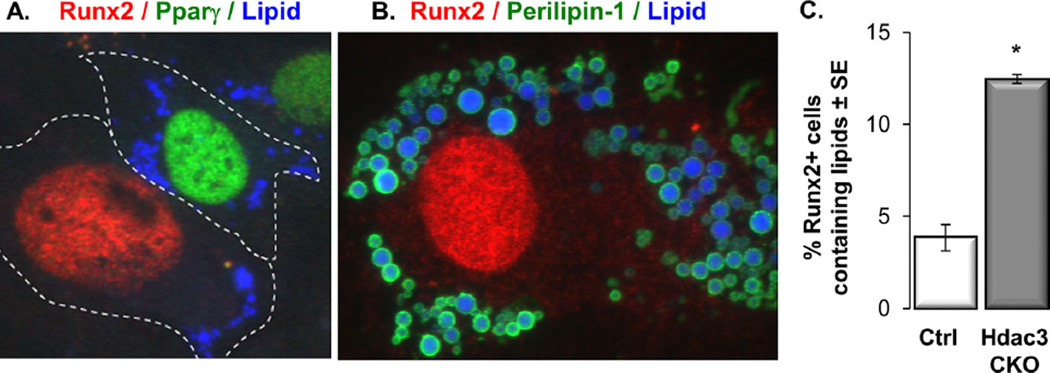
Bone loss and increased marrow adiposity are hallmarks of aging skeletons. Conditional deletion of histone deacetylase 3 (Hdac3) in murine osteochondroprogenitor cells causes osteopenia and increases marrow adiposity, even in young animals, but the origins of the increased adiposity are unclear. To explore this, bone marrow stromal cells (BMSCs) from Hdac3-depleted and control mice were cultured in osteogenic medium. Hdac3-deficient cultures accumulated lipid droplets in greater abundance than control cultures and expressed high levels of genes related to lipid storage (Fsp27/Cidec, Plin1) and glucocorticoid metabolism (Hsd11b1) despite normal levels of Pparγ2. Approximately 5% of the lipid containing cells in the wild-type cultures expressed the master osteoblast transcription factor Runx2, but this population was threefold greater in the Hdac3-depleted cultures. Adenoviral expression of Hdac3 restored normal gene expression, indicating that Hdac3 controls glucocorticoid activation and lipid storage within osteoblast lineage cells. HDAC3 expression was reduced in bone cells from postmenopausal as compared to young women, and in osteoblasts from aged as compared to younger mice. Moreover, phosphorylation of S424 in Hdac3, a posttranslational mark necessary for deacetylase activity, was suppressed in osseous cells from old mice. Thus, concurrent declines in transcription and phosphorylation combine to suppress Hdac3 activity in aging bone, and reduced Hdac3 activity in osteochondroprogenitor cells contributes to increased marrow adiposity associated with aging. © 2015 American Society for Bone and Mineral Research.
Keywords: AGING; HSD11B1; LIPID DROPLETS; OSTEOPOROSIS; RUNX2.
© 2015 American Society for Bone and Mineral Research.
Conflict of interest statement
All authors state that they have no conflicts of interest.
Figures


Similar articles
-
Hdac3-deficiency increases senescence-associated distention of satellite DNA and telomere-associated foci in osteoprogenitor cells.J Bone Miner Res. 2024 Aug 5;39(7):994-1007. doi: 10.1093/jbmr/zjae085. J Bone Miner Res. 2024. PMID: 38843356 Free PMC article.
-
Defective differentiation of adipose precursor cells from lipodystrophic mice lacking perilipin 1.PLoS One. 2015 Feb 19;10(2):e0117536. doi: 10.1371/journal.pone.0117536. eCollection 2015. PLoS One. 2015. PMID: 25695774 Free PMC article.
-
Perilipin1 deficiency in whole body or bone marrow-derived cells attenuates lesions in atherosclerosis-prone mice.PLoS One. 2015 Apr 9;10(4):e0123738. doi: 10.1371/journal.pone.0123738. eCollection 2015. PLoS One. 2015. PMID: 25855981 Free PMC article.
-
Defining osteoblast and adipocyte lineages in the bone marrow.Bone. 2019 Jan;118:2-7. doi: 10.1016/j.bone.2018.05.019. Epub 2018 May 18. Bone. 2019. PMID: 29782940 Free PMC article. Review.
-
Aging of marrow stromal (skeletal) stem cells and their contribution to age-related bone loss.Biochim Biophys Acta. 2009 Apr;1792(4):364-70. doi: 10.1016/j.bbadis.2009.01.008. Epub 2009 Jan 27. Biochim Biophys Acta. 2009. PMID: 19419706 Review.
Cited by
-
Bioenergetic Metabolism In Osteoblast Differentiation.Curr Osteoporos Rep. 2022 Feb;20(1):53-64. doi: 10.1007/s11914-022-00721-2. Epub 2022 Feb 3. Curr Osteoporos Rep. 2022. PMID: 35112289 Free PMC article. Review.
-
The Spectrum of Fundamental Basic Science Discoveries Contributing to Organismal Aging.J Bone Miner Res. 2018 Sep;33(9):1568-1584. doi: 10.1002/jbmr.3564. Epub 2018 Aug 13. J Bone Miner Res. 2018. PMID: 30075061 Free PMC article. Review.
-
Insulin-like growth factor 1-induced enolase 2 deacetylation by HDAC3 promotes metastasis of pancreatic cancer.Signal Transduct Target Ther. 2020 May 13;5(1):53. doi: 10.1038/s41392-020-0146-6. Signal Transduct Target Ther. 2020. PMID: 32398667 Free PMC article.
-
Intracellular lipid droplets support osteoblast function.Adipocyte. 2017 Jul 3;6(3):250-258. doi: 10.1080/21623945.2017.1356505. Epub 2017 Jul 20. Adipocyte. 2017. PMID: 28792783 Free PMC article.
-
The Role of the Kynurenine Pathway in the Pathophysiology of Frailty, Sarcopenia, and Osteoporosis.Nutrients. 2023 Jul 13;15(14):3132. doi: 10.3390/nu15143132. Nutrients. 2023. PMID: 37513550 Free PMC article. Review.
References
-
- Justesen J, Stenderup K, Ebbesen EN, Mosekilde L, Steiniche T, Kassem M. Adipocyte tissue volume in bone marrow is increased with aging and in patients with osteoporosis. Biogerontology. 2001;2(3):165–171. - PubMed
-
- Rosen CJ, Bouxsein ML. Mechanisms of disease: is osteoporosis the obesity of bone? Nat Clin Pract Rheumatol. 2006;2(1):35–43. - PubMed
Publication types
MeSH terms
Substances
Grants and funding
LinkOut - more resources
Full Text Sources
Other Literature Sources
Medical
Molecular Biology Databases
