. 2015 Aug 6;17(2):152-164.
doi: 10.1016/j.stem.2015.06.006. Epub 2015 Jul 23.

Tetraspanin 3 Is Required for the Development and Propagation of Acute Myelogenous Leukemia

Affiliations

Tetraspanin 3 Is Required for the Development and Propagation of Acute Myelogenous Leukemia

Hyog Young Kwon et al. Cell Stem Cell. .

Abstract

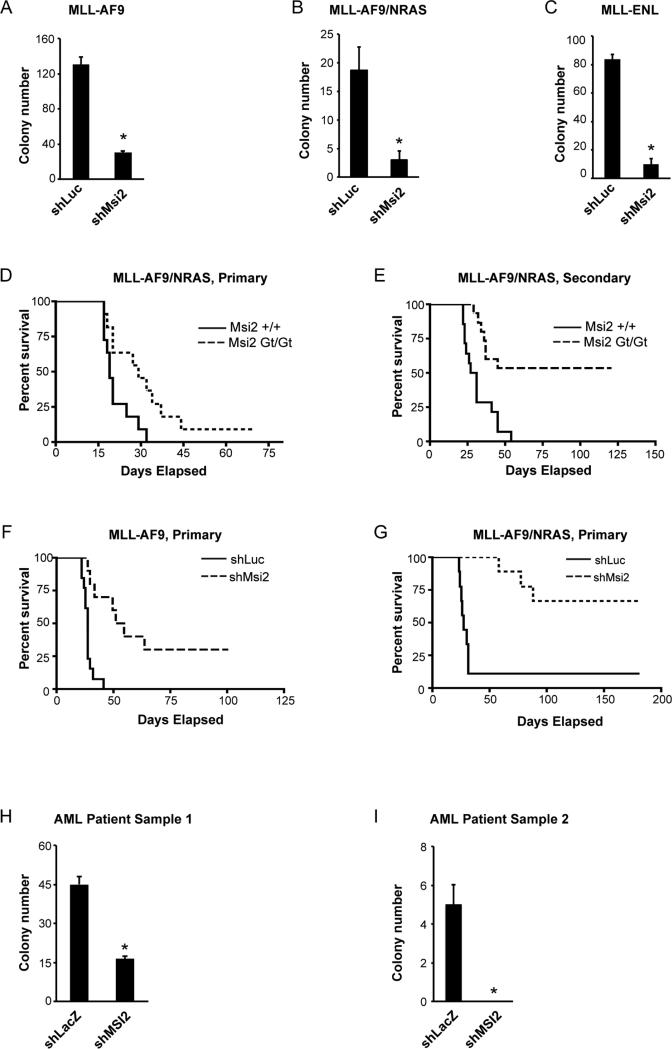
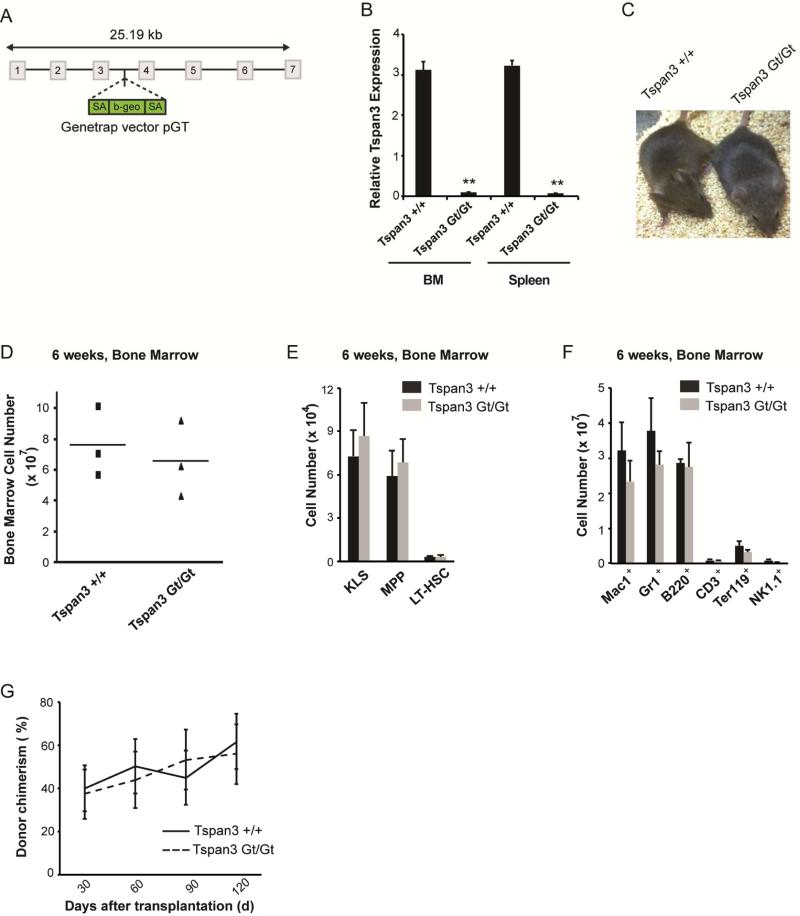
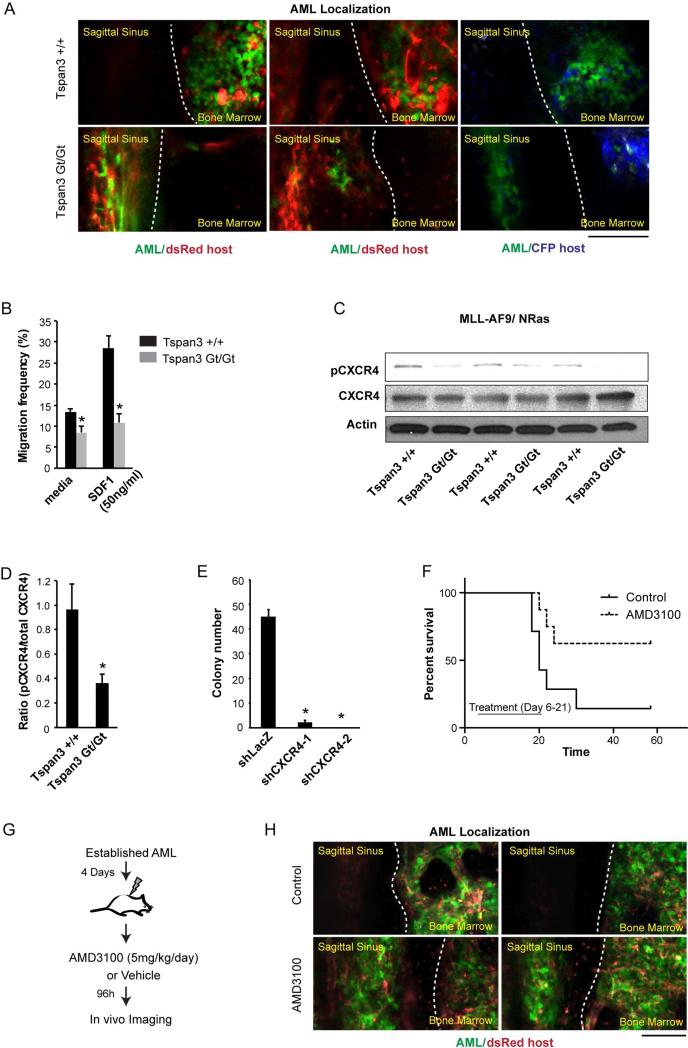
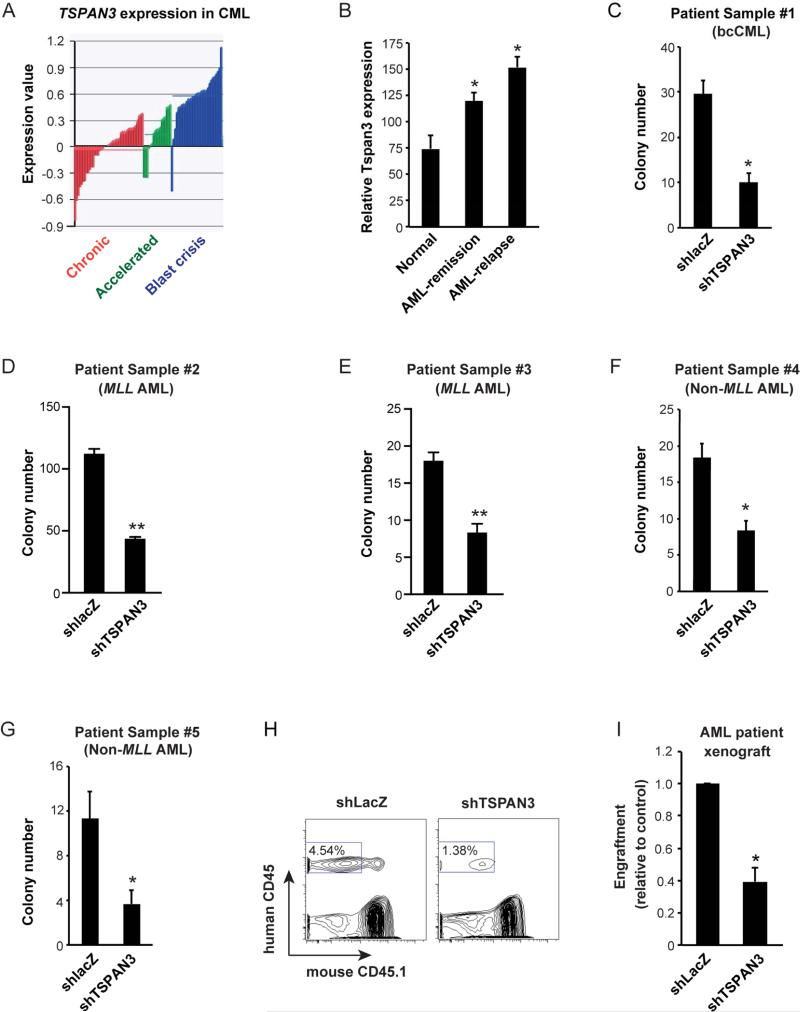
Acute Myelogenous Leukemia (AML) is an aggressive cancer that strikes both adults and children and is frequently resistant to therapy. Thus, identifying signals needed for AML propagation is a critical step toward developing new approaches for treating this disease. Here, we show that Tetraspanin 3 is a target of the RNA binding protein Musashi 2, which plays a key role in AML. We generated Tspan3 knockout mice that were born without overt defects. However, Tspan3 deletion impaired leukemia stem cell self-renewal and disease propagation and markedly improved survival in mouse models of AML. Additionally, Tspan3 inhibition blocked growth of AML patient samples, suggesting that Tspan3 is also important in human disease. As part of the mechanism, we show that Tspan3 deficiency disabled responses to CXCL12/SDF-1 and led to defects in AML localization within the niche. These identify Tspan3 as an important regulator of aggressive leukemias and highlight a role for Tspan3 in oncogenesis.


Figures

Figure 1
Figure 1. MLL-driven primary Acute Myelogenous Leukemia is dependent on Msi2
(A-C) Colony-forming ability of established MLL-AF9 (A), MLL-AF9/NRAS (B) and MLL-ENL (C) leukemia. cKit+ leukemic cells (A and B) or Mac1+ cells (C) were transduced with either firefly luciferase shRNA as a control (shLuc) or Msi2 shRNA (shMsi2), sorted and plated in methylcellulose media to assess primary colony formation. Representative data from two to four independent experiments are shown. Error bars represent s.e.m. *p<0.05. (D) Survival curve of mice receiving MLL-AF9/NRAS-infected control or Msi2 null KLS cells. Data shown is from three independent transplant experiments (n=11; p=0.016). (E) Survival curve of mice receiving established MLL-AF9/NRAS cKit+ leukemic cells derived from wild type or Msi2 null mice. Data shown is from three independent transplant experiments (control, n=14; Msi2 null, n=15; p<0.001). (F and G) Survival curve of mice receiving MLL-AF9 cells (F) or MLL-AF9/NRAS cells (G) infected with either control shLuc or shMsi2. (F, n=10, p<0.0001; G n=9, p=0.0011). (H and I) Patient-derived AML samples were infected with either a control virus (shLacZ) or MSI2 knockdown lentivirus (shMSI2), sorted and plated in methylcellulose media to assess primary colony formation. Error bars represent s.e.m. *p<0.05. See also Figure S1.
Figure 2
Figure 2. Genomic scale analysis of shared programs in AML and bcCML stem cells
(A) A schematic of the strategy used for genome wide gene expression analysis of Msi2-deficient AML and bcCML. (B) Representation of concordantly and discordantly regulated genes in wild type and Msi2 null bcCML and AML leukemic cells. (C) Venn diagrams displaying the intersection of probe sets that are differentially regulated in wild type and Msi2 null bcCML and AML. (D and E) Heat maps indicating commonly dysregulated genes in both bcCML and MLL-AF9 leukemia (D) and top-ranked dysregulated oncogenic signals (E); selected genes linked to oncogenesis are shown. (F) Expression level of Tspan3 in different cell populations from mouse bone marrow were analyzed by RT-PCR. Representative data from two independent experiments is shown. (G) Expression level of Tspan3 in control and Msi2 null MLL-AF9 leukemia cells determined from microarray analysis; n=3, *p<0.05. (H) cKit+ leukemia cells from MLL-AF9/NRAS-driven AML were infected with either a control or Msi2 shRNA virus and Tspan3 expression was analyzed by RT-PCR; n=2, *p<0.05. (I) Wild type KLS cells were infected with either a control virus or Msi2-expressing virus, and expression levels of Tspan3 were analyzed by real-time PCR. Representative data from two independent experiments is shown. (J) Graph shows relative enrichment in TSPAN3, ACTIN and IGF2 mRNA levels by real-time PCR following RNA-immunoprecipitation with anti-Flag antibody from MV411 AML cells expressing Flag-GFP or Flag-Msi2. (K) Colony-forming ability of cKit+ cells from MLL-AF9/NRAS leukemia infected with either shLuc and Vector, shMsi2 and Vector, or shMsi2 and Tspan3. Representative data from two independent experiments is shown. Error bars represent s.e.m. *p<0.05. See also Figure S2.
Figure 3
Figure 3. Generation and analysis of Tspan3 knockout mice
(A) Schematic diagram of integration site of gene trap vector used to generate Tspan3 null mice. (B) Spleen and whole bone marrow cells were isolated from wild type and Tspan3 null mice, and RT-PCR analysis was performed to determine expression of Tspan3. (C) Image of 2 month old wild type and Tspan3 null mice. (D) Total cellularity of bone marrow from 6 week old wild type and Tspan3 null mice. (E and F) Bone marrow cells from wild type or Tspan3 null mice were analyzed for hematopoietic lineage development; n=3. (G) Average donor chimerism in lethally irradiated recipients transplanted with wild type or Tspan3 null LT-HSCs (500 LT-HSCs/mouse); n=6 recipients per cohort. Data shown are from two independent experiments. Error bars represent s.e.m. See also Figure S3.
Figure 4
Figure 4. Loss of Tspan3 impairs the development and propagation of MLL-driven acute myelogenous leukemia
(A) Experimental strategy to generate MLL-AF9/NRAS-driven leukemia from wild type or Tspan3 null mice. (B) Survival curve of mice receiving MLL-AF9/NRAS-infected wild type or Tspan3 null KLS cells. Data shown are from four independent experiments (wild type, n=19; Tspan3 null, n=15; p=0.0152). (C) Relative expression of Tspan3 mRNA in cKit+ Gr1 cells isolated from MLL-AF9/NRAS and in bulk leukemia (p<0.05) (D) Survival curve of mice receiving established MLL-AF9/NRAS cKit+ leukemic cells derived from wild type or Tspan3 null mice. Data shown are from three independent experiments (wild type, n=15; Tspan3 null, n=16; p<0.0001). (E and F) Survival curve of mice receiving established MLL-AF9 (E) or MLL-AF9/NRAS cells (F) infected with either control shLuc or shTspan3 virus; (E, n=19, p=0.02; F, n=7 for control, n=10 for shTspan3, p=0.0011). (G) MLL-AF9/NRAS-driven leukemic cKit+ cells were obtained from wild type or Tspan3 null leukemic mice, plated in methylcellulose in the presence of the indicated cytokines for 7 days and colony formation assessed. (H) Relative expression of indicated genes in Msi2 null cKit+Sca1Lin MLL-AF9 or Tspan3 null cKit+ MLL-AF9/NRAS leukemia as compared to their respective wild-type controls. Genes were selected from the genomic analysis of Msi2 null leukemic cells shown in Figure 2; n=3. Error bars represent s.e.m., *p<0.05. See also Figure S4.
Figure 5
Figure 5. Tspan3 is required for normal migration and SDF responsiveness of AML cells
(A) In vivo image of bone marrow region in mouse calvarium. MLL-AF9/NRAS-driven leukemic cells obtained from wild type or Tspan3 null leukemia were injected retro-orbitally into sublethally irradiated dsRed or CFP mice and the calvarial bone marrow analyzed 8 to 15 days afterward to assess localization within the bone marrow niche. The images shown were acquired in a single plane. Tspan3Gt/Gt images focus on central sinusoid region to show aberrant enrichment of cells. (B) Migration of wild type and Tspan3 null MLL-AF9/NRAS leukemic cells to SDF1 was measured 4 hours after exposure. Error bars represent s.e.m., *p<0.05. (C and D) Protein lysates from wild type and Tspan3 null -driven leukemia were analyzed by western blot for phosphorylated CXCR4 (C) and band intensity was quantified using Image J (D). (E) Colony-forming ability of cKit+ MLL-AF9/NRAS leukemia transduced with either firefly luciferase shRNA as a control (shLuc) or two independent CXCR4 shRNAs (shCXCR4). (F) Survival curve of mice transplanted with established cKit+ MLL-AF9/NRAS leukemic wild type or Tspan3 null cells. Mice were treated with 5mg/kg/day AMD3100 or vehicle (water) for 15 days, starting 6 days post-transplant (n=8 for each cohort, data compiled from two independent experiments), p<0.05 (G) Experimental scheme for imaging leukemia localization in vivo following CXCR4 inhibition (E) In vivo image of bone marrow region (red) showing defects in localization of MLL-AF9/NRAS- leukemia cells (green) following AMD3100 treatment. Dotted white line demarcates the boundary between central sinusoid and bone marrow regions. Images are maximum intensity projections of on average 60μm z-stacks. Scale bar represents 100μm. Error bars represent s.e.m., *p<0.05. See also Figure S5.
Figure 6
Figure 6. TSPAN3 is required for growth of human myeloid leukemia in vitro and in xenografts
(A) Expression of TSPAN3 is shown in bone marrow and peripheral blood samples from 42 chronic phase (CP, red bars), 17 accelerated phase (AP, green bars), and 31 blast crisis (BC, dark blue bars) CML patient samples. Gene expression data were obtained using the Rosetta platform; data are expressed as the log10 ratio of the normalized expression of TSPAN3 in each patient sample compared to its expression in a pool of CP CML patients. (B) Analysis of gene expression data with increased Tspan3 in normal, AML-remission and AML-relapse samples. (C-G) Patient-derived bcCML (C), AML carrying MLL-translocations (D and E) and AML without MLL-translocations (F and G) were infected with either control (shlacZ) or TSPAN3 knockdown lentivirus (shTSPAN3), sorted and plated in methylcellulose media to assess colony formation. (H and I) Peripheral blood chimerism in NSG mice transplanted with primary patient AML samples following TSPAN3 knockdown. Patient-derived leukemic samples were infected with either control (shlacZ) or TSPAN3 knockdown lentivirus (shTSPAN3), transplanted into sublethally irradiated NSG recipients, and chimerism determined after 2 months. Data from two independent experiments are displayed relative to control set at 1. Error bars represent s.e.m. n=4, *p<0.05. See also Figure S6.

Similar articles

Cited by

References

    1. Boucheix C, Duc GH, Jasmin C, Rubinstein E. Tetraspanins and malignancy. Expert reviews in molecular medicine. 2001;2001:1–17. - PubMed
    1. Byers RJ, Currie T, Tholouli E, Rodig SJ, Kutok JL. MSI2 protein expression predicts unfavorable outcome in acute myeloid leukemia. Blood. 2011;118:2857–2867. - PubMed
    1. Chen Y, Cortes J, Estrov Z, Faderl S, Qiao W, Abruzzo L, Garcia-Manero G, Pierce S, Huang X, Kebriaei P, et al. Persistence of cytogenetic abnormalities at complete remission after induction in patients with acute myeloid leukemia: prognostic significance and the potential role of allogeneic stem-cell transplantation. Journal of clinical oncology : official journal of the American Society of Clinical Oncology. 2011;29:2507–2513. - PMC - PubMed
    1. Chen Y, Jacamo R, Konopleva M, Garzon R, Croce C, Andreeff M. CXCR4 downregulation of let-7a drives chemoresistance in acute myeloid leukemia. The Journal of clinical investigation. 2013;123:2395–2407. - PMC - PubMed
    1. Christiansen DH, Andersen MK, Desta F, Pedersen-Bjergaard J. Mutations of genes in the receptor tyrosine kinase (RTK)/RAS-BRAF signal transduction pathway in therapy-related myelodysplasia and acute myeloid leukemia. Leukemia : official journal of the Leukemia Society of America, Leukemia Research Fund, UK. 2005;19:2232–2240. - PubMed

Publication types

MeSH terms

Associated data