. 2015 Nov;33(11):3382-96.
doi: 10.1002/stem.2100. Epub 2015 Jul 24.

Fanconi Anemia Mesenchymal Stromal Cells-Derived Glycerophospholipids Skew Hematopoietic Stem Cell Differentiation Through Toll-Like Receptor Signaling

Affiliations

Fanconi Anemia Mesenchymal Stromal Cells-Derived Glycerophospholipids Skew Hematopoietic Stem Cell Differentiation Through Toll-Like Receptor Signaling

Surya Amarachintha et al. Stem Cells. 2015 Nov.

Abstract

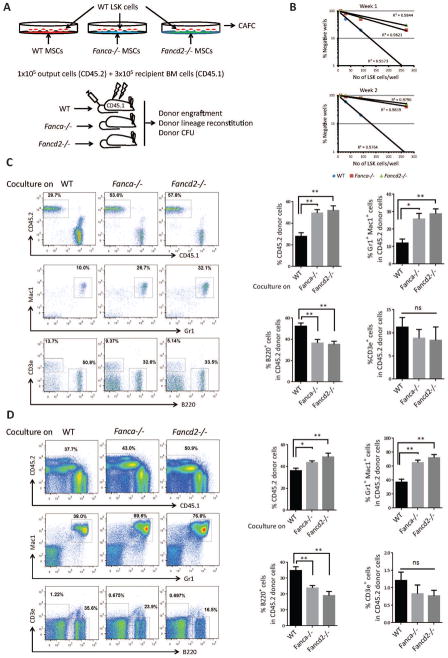
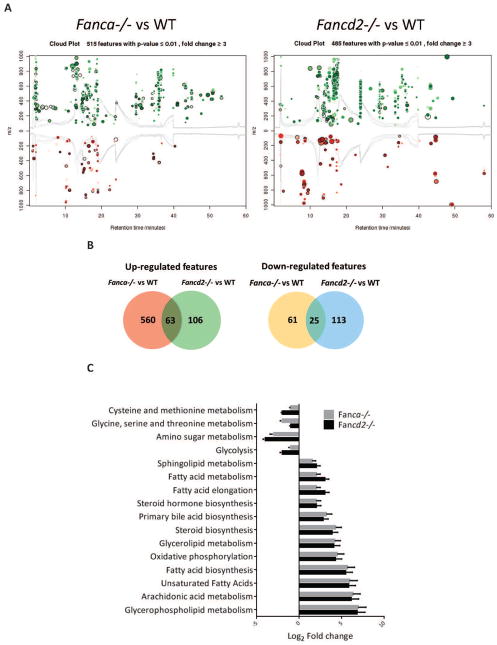
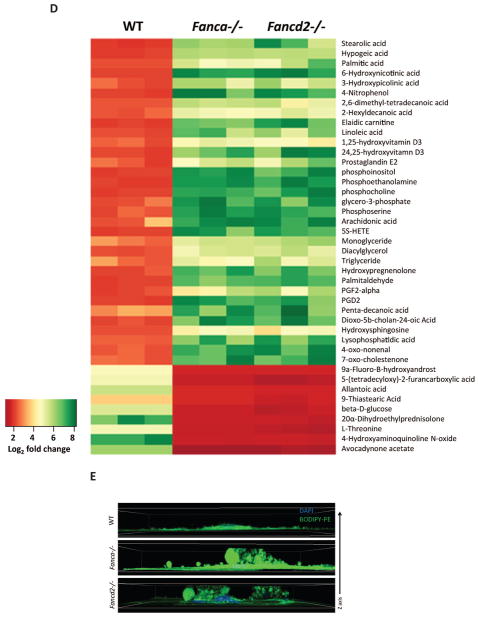
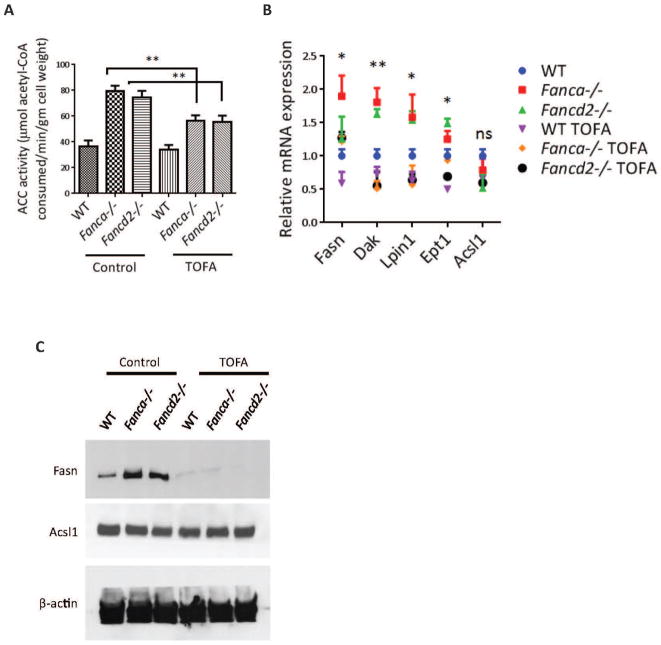
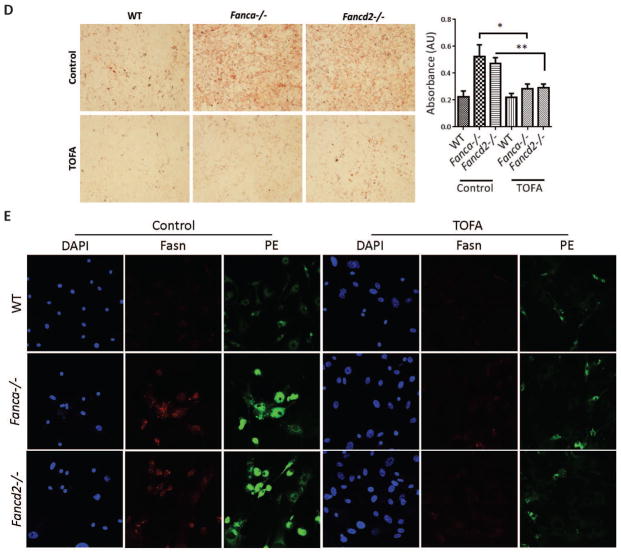
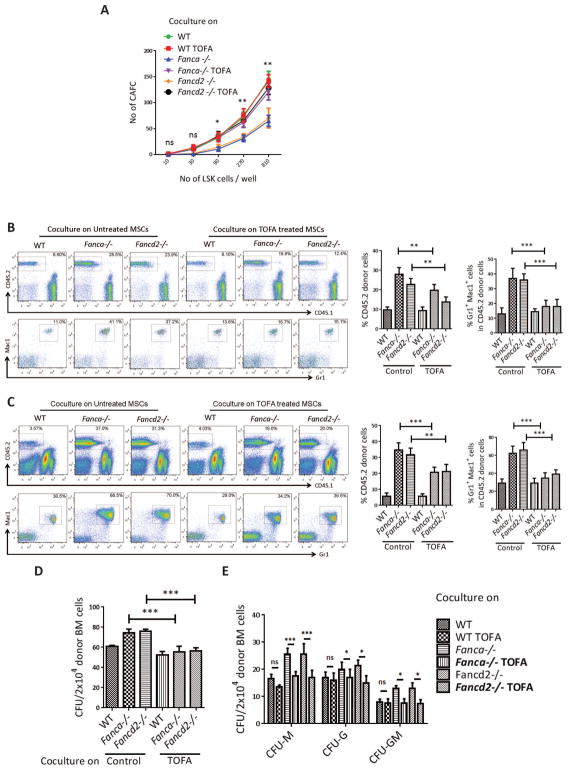
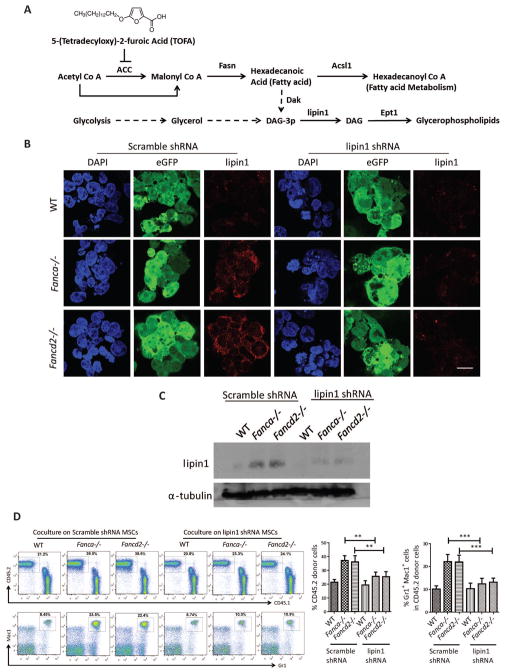
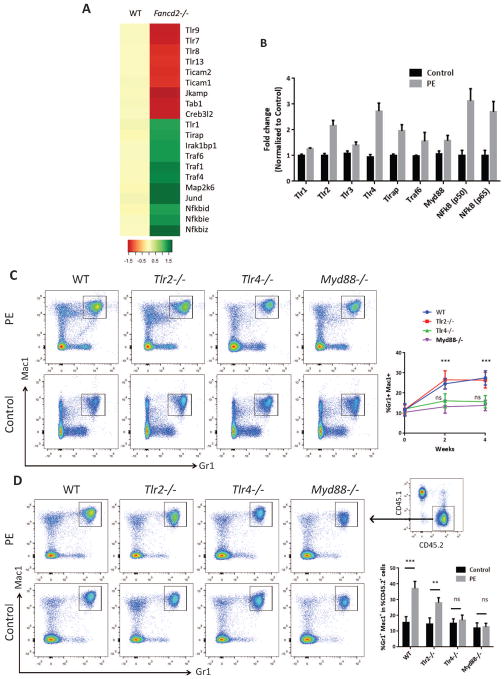
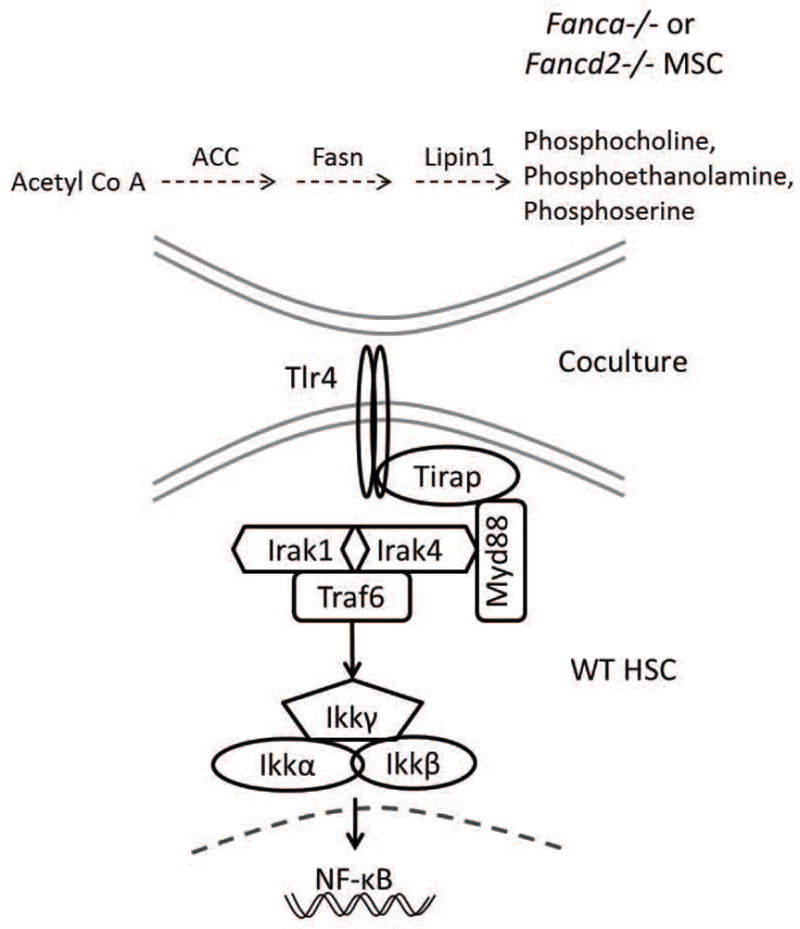
Fanconi anemia (FA) patients develop bone marrow (BM) failure or leukemia. One standard care for these devastating complications is hematopoietic stem cell transplantation. We identified a group of mesenchymal stromal cells (MSCs)-derived metabolites, glycerophospholipids, and their endogenous inhibitor, 5-(tetradecyloxy)-2-furoic acid (TOFA), as regulators of donor hematopoietic stem and progenitor cells. We provided two pieces of evidence that TOFA could improve hematopoiesis-supporting function of FA MSCs: (a) limiting-dilution cobblestone area-forming cell assay revealed that TOFA significantly increased cobblestone colonies in Fanca-/- or Fancd2-/- cocultures compared to untreated cocultures. (b) Competitive repopulating assay using output cells collected from cocultures showed that TOFA greatly alleviated the abnormal expansion of the donor myeloid (CD45.2+Gr1+Mac1+) compartment in both peripheral blood and BM of recipient mice transplanted with cells from Fanca-/- or Fancd2-/- cocultures. Furthermore, mechanistic studies identified Tlr4 signaling as the responsible pathway mediating the effect of glycerophospholipids. Thus, targeting glycerophospholipid biosynthesis in FA MSCs could be a therapeutic strategy to improve hematopoiesis and stem cell transplantation.

Keywords: Fanconi anemia; Hematopoietic stem cell transplantation; Marrow stromal stem cells; Myeloid cells.


Conflict of interest statement

Conflict-of-interest disclosure: The authors declare no competing financial interests.

Figures

Figure 1
Figure 1. Fanca−/− and Fancd2−/− MSCs impairs WT HSPC self-renewal and induces myeloid expansion
(A) Schematic representation of the ex vivo coculture experiments. WT LSK (Lin-Sca1+c-kit+) cells isolated by FACS were cultured on confluent stromal layers of WT, Fanca−/− or Fancd2−/− MSCs followed by in CAFC or BM transplantation (BMT). (B) Limited dilution analysis of CAFC assay. Assay was conducted in a flat bottom 96 well plate with confluent MSCs before plating the sorted LSK cells. Cultures were maintained in 40% methyl cellulose medium for two weeks and the colonies were counted on week 1 and 2. Group of at least 6 phase dim cells were counted as one colony. (C) Abnormal myeloid expansion of WT HSPCs cocultured on Fanca−/− or Fancd2−/− MSCs in peripheral blood of irradiated recipient mice. 1×10⁵ WT output cells (CD45.2+) collected after coculturing on WT, Fanca−/− or Fancd2−/− MSCs for five days, along with 3×10⁵ recipient BM cells (CD45.1+), were injected into each lethally irradiated recipient mouse. Donor chimerism and lineage reconstitution in peripheral blood of the recipients were examined at 4 months post transplantation. Representative flow plots (Left) and quantifications (Right) are shown. Results are means plus or minus SD of 3 independent experiments (n=9 per group). (D) Abnormal myeloid expansion of WT HSPCs cocultured on Fanca−/− or Fancd2−/− MSCs in the BM of irradiated recipient mice. Flow analysis of donor chimerism and lineage reconstitution in the BM of the recipients, described in (C), at 4 months post-BMT. Representative flow plots (Left) and quantifications (Right) are shown. Results are means plus or minus SD of 3 independent experiments (n=9 per group). *P<0.05, **P<0.01, ***P<0.001, ns: not significant. Error bars represent mean ± SD.
Figure 2
Figure 2. Metabolome profile of Fanca−/− and Fancd2−/− MSCs reveals abnormal glycerophospholipid biosynthesis
(A) Cloud plot presentation of metabolite features of Fanca−/− MSCs vs WT MSCs and Fancd2−/− MSCs vs WT MSCs with fold change ≥ 3 and pValue≤0.01. The statistical significance of the fold change was calculated by a Welch t test with unequal variances. Up-regulated features (features that have a positive fold change) are graphed above the x-axis in green while down-regulated features (features that have a negative fold change) are graphed below the x-axis in red. The x-axis represents retention time. The y-axis represents mass-to-charge (m/z) ratio. Features with higher fold change have larger radii. Features with lower p-value have higher color intensity. (B) Venn diagram demonstrating the separate and overlapping metabolite features in Fanca−/− and Fancd2−/− MSCs compared to WT MSCs showing both up and down regulated with fold change≥3 and pValue≤0.01. (C) Summary plot for metabolite set enrichment analysis (MSEA) where metabolic pathways are ranked according to Log2 fold change with the cut off p-value ≤0.01. (D) Heat map of significantly altered metabolite features up and down regulated in both Fanca−/− and Fancd2−/− MSCs plotted against Log2 fold change (Metabolite extraction for the metabolome profile was done from independently derived MSCs). (E) Immunofluorescence of MSCs. WT, Fanca−/−, and Fancd2−/− MSCs were stained with BODIPY-PE and DAPI. The images were the Z-stack images captured with Nikon C2+ confocal microscope.
Figure 3
Figure 3. TOFA suppresses lipid biosynthesis in Fanca−/− and Fancd2−/− MSCs
(A) TOFA suppresses Acetyl-CoA carboxylase (ACC) activity in MSCs. Independently derived WT, Fanca−/−, and Fancd2−/− MSCs were treated with or without 8μM TOFA for 48 hrs before measuring the ACC enzyme activity. The levels of acetyl-CoA remaining in each sample were determined using a citrate synthase assay, in which the formation of the yellow compound dithiobisnitrobenzoic acidthiophenolate was measured spectrophotometrically at 412 nm. ACC Activity was expressed as μM acetyl-CoA consumed/min/gm dry cell weight. (B) Relative gene expression of genes involved in glycerophospholipid biosynthesis. Total mRNA was collected from MSCs either treated with or without 8μM TOFA for 48 hrs. mRNA expression levels of the enzymes involved in the glycerophospholipid synthesis pathway were measured. Significance is seen between TOFA treated and untreated Fanca−/− or Fancd2−/− MSCs. (C) Western blot of MSCs. Protein lysates were collected from MSCs treated with or without 8μM TOFA for 48 hrs. Lysate was then subjected to 8% Protein gel separation and blotted for Fasn, Acsl1 antibodies, while β-actin was probed as loading control. (D) Oil Red O staining of MSCs. 48hrs after TOFA treatment, MSCs were stained with Oil Red O stain to image the total lipids synthesized in the cells. Representative images (Left; 100× magnification) and quantifications (Right) are shown. Absorbance of Oil Red O stain collected from the stained cells by dissolving in 100% isopropanol was measured at 500nm and blanked to 100% isopropanol. (E) Immunofluorescence of MSCs. MSCs treated with or without 8μM TOFA were stained for Fasn antibody, BODIPY-PE, and DAPI. The images were captured with Nikon C2+ confocal microscope (600× magnification). *P<0.05, **P<0.01, ns: not significant. Error bars represent mean ± SD.
Figure 4
Figure 4. TOFA suppresses abnormal differentiation of HSCs into myeloid cells
(A) TOFA rescues stemness of cocultured WT HSPCs. Confluent WT, Fanca−/− or Fancd2−/− MSCs were pretreated with TOFA (8μM) for 48 hrs, and graded numbers of flow sorted WT LSK were plated on confluent stromal layers of WT, Fanca−/− or Fancd2−/− MSCs. Scoring of Cobblestone area as endpoint was determined after 7 days. (B) TOFA prevents abnormal expansion of donor myeloid cells in peripheral blood of irradiated recipient mice. Confluent WT, Fanca−/− or Fancd2−/− MSCs were pre-treated with TOFA (8μM) for 48 hrs, and flow sorted WT LSK were added to the cultures. Five days later, 1×10⁵ WT output cells (CD45.2+) were collected and, along with 3×10⁵ recipient BM cells (CD45.1+), injected into each lethally irradiated recipient mouse. Donor chimerism and lineage reconstitution in peripheral blood of the recipients were examined at 4 months post transplantation. Representative flow plots (Left) and quantifications (Right) are shown. Results are means plus or minus SD of 3 independent experiments (n=9 per group). (C) TOFA prevents abnormal expansion of donor myeloid cells in the BM of irradiated recipient mice. Flow analysis of donor chimerism and lineage reconstitution in the BM of the recipients, described in (A), at 4 months post-BMT. Representative flow plots (Left) and quantifications (Right) are shown. Results are means plus or minus SD of 3 independent experiments (n=9 per group). (D) CFU of donor-derived (CD45.2+) bone marrow cells. 2×10⁴ BMMCs isolated from transplant recipients, described in (A), at 4 months post-BMT were plated in triplicates (n=3–5 recipient mice). CFU is the total count of BFU-E, CFU-M, CFU-G, CFU-GM, CFU-GEMM, and Pre-B colonies. (E) CFU of progenitor lineages having significant difference. *P<0.05, **P<0.01, ***P<0.001, ns: not significant. Error bars represent mean ± SD.
Figure 5
Figure 5. Lipin1 shRNA knockdown in Fanca−/− or Fancd2−/− MSCs supresses myeloid proliferation of cocultured LSK cells
(A) Schematic presentation of de novo synthesis of glycerophospholipids. TOFA inhibits the activity of ACC by blocking the conversion of Acetyl-CoA to Malonyl-CoA, a major substrate for glycerophospholipid biosynthesis. (B) Immunofluorescence of MSCs infected with lentiviruses. MSCs were transduced with lentivirus encoding a non-targeting shRNA (Scramble) or shRNAs targeting lipin1 (lipin1). Nucleus was stained with DAPI. Lentivirus expression was shown as eGFP. Lipin1 was shown as red. The images were captured with Nikon C2+ confocal micrscope. The scale bar represents 20μM. (C) Western blot analysis of MSCs infected with lentiviruses. Protein lysates were collected from MSCs infected with scramble shRNA and lipin1 shRNA lentiviruses. Lysate was then subjected to 8% Protein gel separation and blotted for lipin1, while α-tubulin was probed as loading control. (D) Flow analysis of peripheral blood for chimera and cell lineage after 16week post-BMT. Competitive repopulating assay was done with 1×10⁵ WT output cells (CD45.2+) collected from cocultures on transduced WT, Fanca−/− or Fancd2−/−MSCs for five days, along with 3×10⁵ recipient BM cells (CD45.1), were injected into each lethally irradiated recipient mouse. Donor chimerism and lineage reconstitution in peripheral blood of the recipients were examined at 4 months post transplantation. Representative flow plots (Left) and quantifications (Right) are shown. Results are means plus or minus SD of 3 independent experiments (n= 6 – 9 mice per condition). *P<0.05, **P<0.01, ***P<0.001, ns: not significant. Error bars represent mean ± SD.
Figure 6
Figure 6. Glycerophospholipids alters HSC differentiation through Tlr4 signaling
(A) Heat map presentation of the toll like receptor signaling pathway from microarray analysis of LSK – SLAM cells from WT and Fancd2−/− mice (accession number GSE64215 at http://www.ncbi.nlm.nih.gov/geo/). (B) Relative gene expression of genes involved in response to PE treatment. Total mRNA was collected from WT LSKs either treated with or without 1mM PE for 24 hrs. mRNA expression levels of the genes involved in the response to PE as ligand were normalized to the housekeeping gene GAPDH. (C) Peripheral blood analysis from WT, Tlr2−/−, Tlr4−/−, Myd88−/− mice intrafemorally injected with either 1mM PE or phosphate-buffered saline (PBS) alone and analyzed for Gr1+ and Mac1+ cells by flow cytometry at 2 and 4 weeks post injections. Representative flow plots (Left) and quantifications (Right) are shown. Results are means plus or minus SD of 3 independent experiments (n= 9 per group). (D) Abnormal myeloid expansion of WT and Tlr2−/− but not Tlr4−/−, and Myd88−/− HSPCs treated with 1mM PE in peripheral blood of irradiated recipient mice. 1×10⁵ WT, Tlr2−/−, Tlr4−/−, and Myd88−/− (CD45.2) LSK cells pre-treated with or without (Control) 1,2-Dipalmitoyl-sn-glycero-3-phosphoethanolamine (PE; 1mM) for 24hrs, along with 3×10⁵ recipient BM cells (CD45.1), were injected into each lethally irradiated recipient mouse. Donor chimerism and lineage reconstitution in peripheral blood of the recipients were examined at 8 weeks post transplantation after stable hematopoietic reconstitution was established. Representative flow plots (Left) and quantifications (Right) are shown. Gr1+Mac1+ cells were analyzed from CD45.2 donor derived cells as shown in the insert. Results are means plus or minus SD of 3 independent experiments (n=9 per group). *P<0.05, **P<0.01, ***P<0.001. Error bars represent mean ± SD.
Figure 7
Figure 7. Model of glycerophosholipids-activated Tlr4-MyD88 signaling in HSC differentiation
Overproduced glycerophosholipids, including phosphocholine (PC), phosphoethanolamine (PE) and phosposerine (PS), in Fanca−/− and Fancd2−/− MSCs may act as ligands to activate Tlr4 receptor in co-cultured WT HSC. Tlr4 in turn signals through MyD88 to activate an NF-kB transcriptional program that leads to upregulation of myeloid-specific gene expression and consequently abnormal myeloid differentiation.

References

    1. Bagby GC., Jr Genetic basis of Fanconi anemia. Curr Opin Hematol. 2003;10(1):68–76. - PubMed
    1. Shimamura A, Alter BP. Pathophysiology and management of inherited bone marrow failure syndromes. Blood Rev. 2010;24(3):101–122. - PMC - PubMed
    1. Kee Y, D’Andrea AD. Molecular pathogenesis and clinical management of Fanconi anemia. J Clin Invest. 2012;122(11):3799–3806. - PMC - PubMed
    1. Deans AJ, West SC. DNA interstrand crosslink repair and cancer. Nat Rev Cancer. 2011;11(7):467–480. - PMC - PubMed
    1. Kottemann MC, Smogorzewska A. Fanconi anaemia and the repair of Watson and Crick DNA crosslinks. Nature. 2013;493(7432):356–363. - PMC - PubMed

Publication types

MeSH terms

Substances