. 2015 Aug 5;87(3):657-70.
doi: 10.1016/j.neuron.2015.06.037. Epub 2015 Jul 23.

Functional System and Areal Organization of a Highly Sampled Individual Human Brain

Affiliations

Functional System and Areal Organization of a Highly Sampled Individual Human Brain

Timothy O Laumann et al. Neuron. .

Abstract

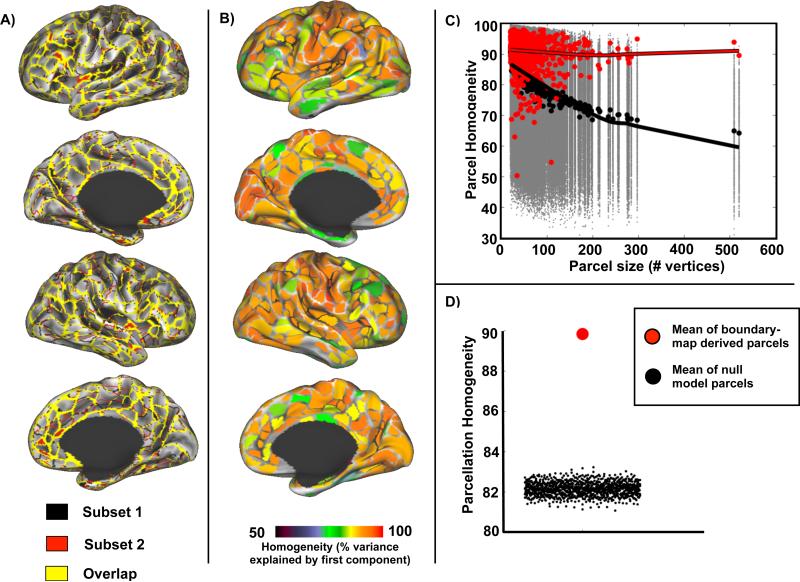
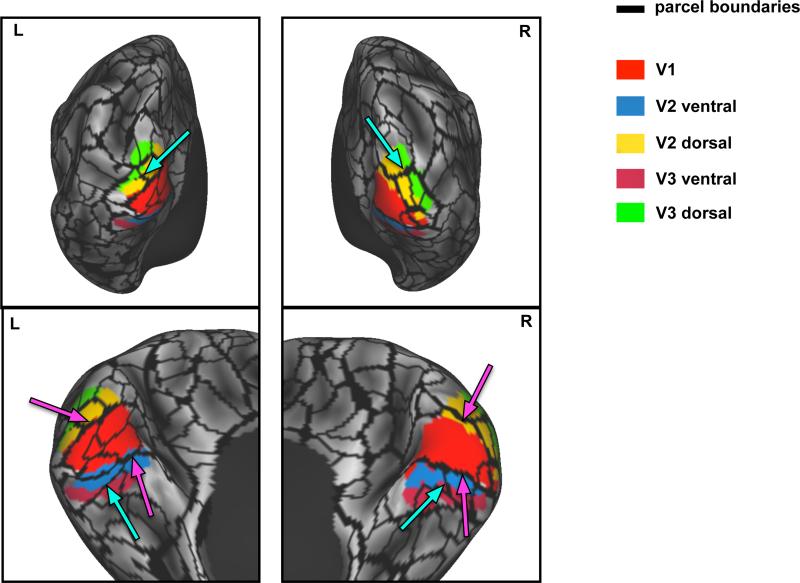
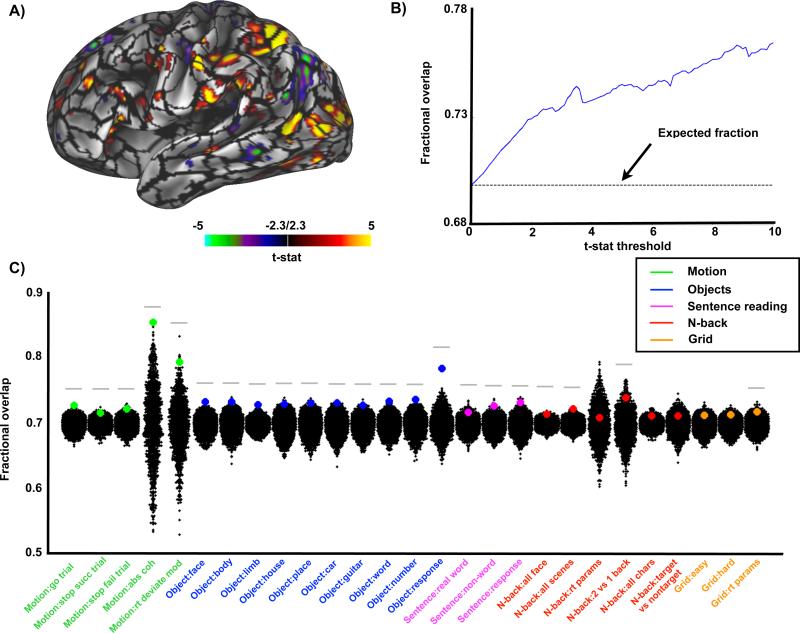
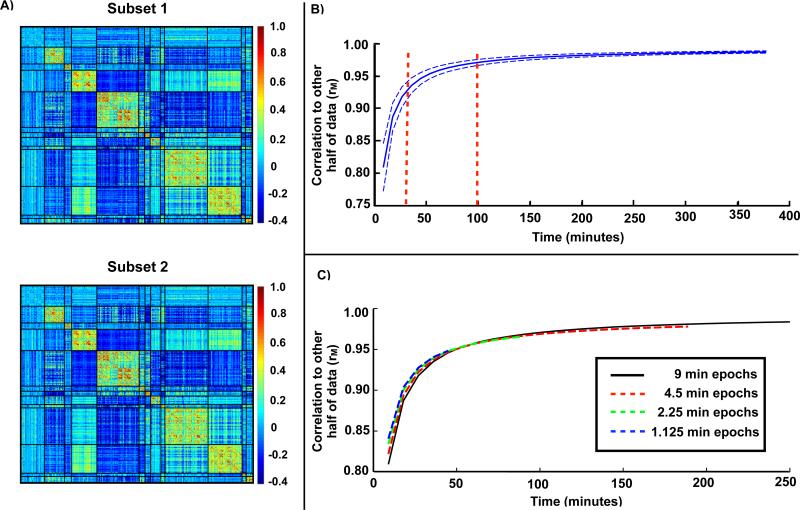
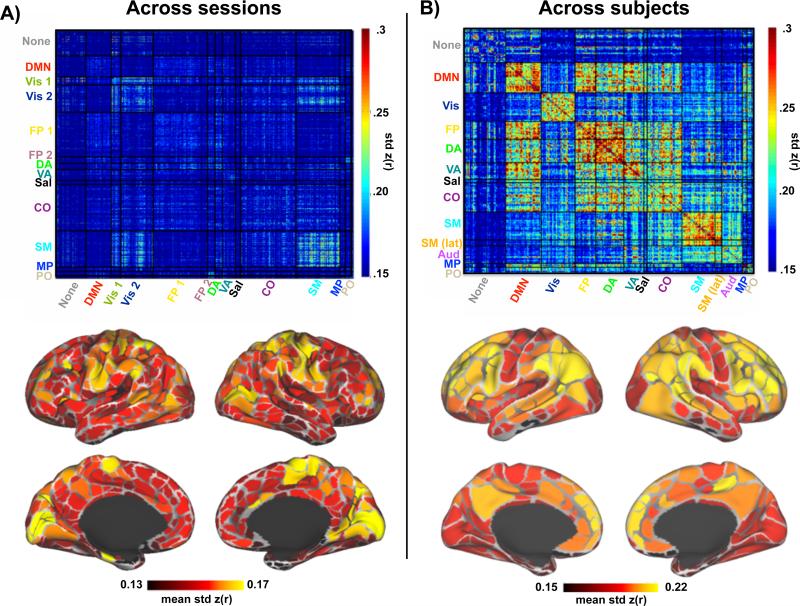
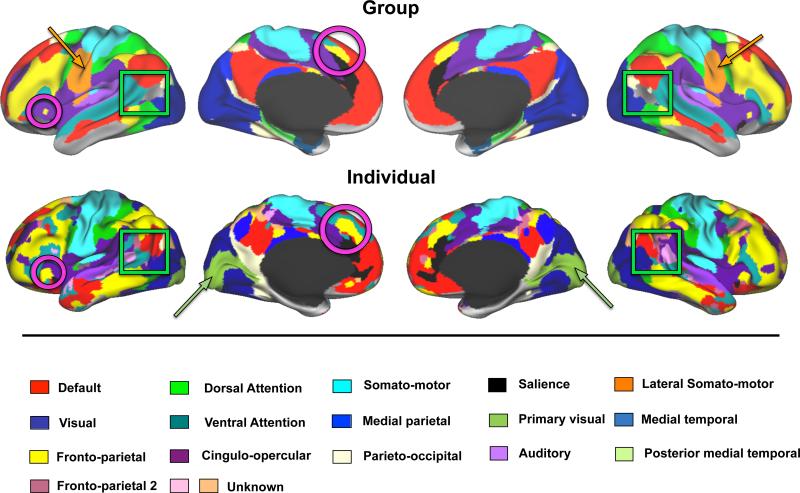
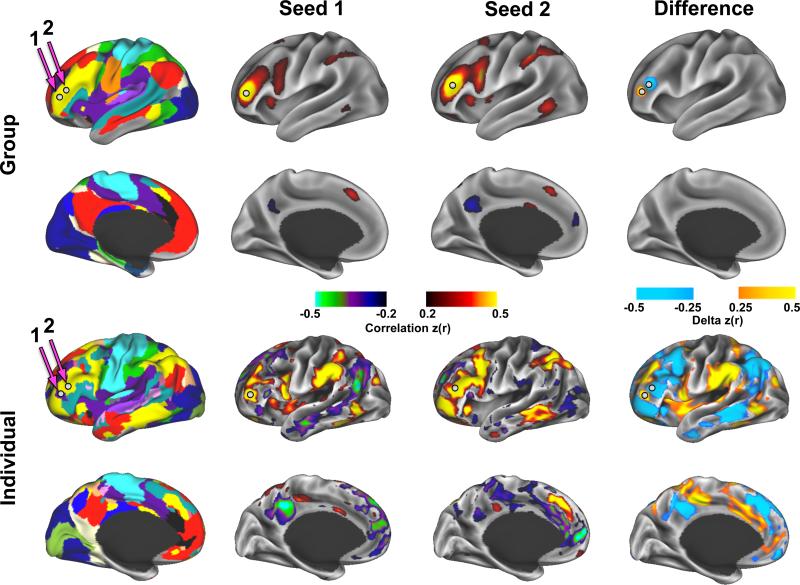
Resting state functional MRI (fMRI) has enabled description of group-level functional brain organization at multiple spatial scales. However, cross-subject averaging may obscure patterns of brain organization specific to each individual. Here, we characterized the brain organization of a single individual repeatedly measured over more than a year. We report a reproducible and internally valid subject-specific areal-level parcellation that corresponds with subject-specific task activations. Highly convergent correlation network estimates can be derived from this parcellation if sufficient data are collected-considerably more than typically acquired. Notably, within-subject correlation variability across sessions exhibited a heterogeneous distribution across the cortex concentrated in visual and somato-motor regions, distinct from the pattern of intersubject variability. Further, although the individual's systems-level organization is broadly similar to the group, it demonstrates distinct topological features. These results provide a foundation for studies of individual differences in cortical organization and function, especially for special or rare individuals. VIDEO ABSTRACT.


Figures

Figure 1
Figure 1
Subject-specific parcellation is reproducible and internally valid. A) RSFC-based parcellation produces highly overlapping (yellow) parcel boundaries in two independent subsets of sessions (n = 42 per subset). B) Homogeneity of each parcel calculated as the percent of variance explained by the first eigenvector computed from PCA of the RSFC patterns from vertices in the parcel. C) Homogeneity of real parcels (red dots) by parcel size compared to homogeneity of null model parcels (gray dots). Black dots indicate median homogeneity across iterations for each null model parcel. Lowess fit lines highlight the effect of parcel size on homogeneity for the individual subject parcels (red line) and the null model parcels (black line). D) Mean homogeneity across parcels in the real parcellation (red dot) is significantly higher (Z-score = 23.1) than the mean homogeneity from null model parcellations (black dots).
Figure 2
Figure 2
Parcel boundaries defined in individual correspond with boundaries between retinotopically defined visual regions derived from the same subject. Magenta arrows indicate correspondence between the RSFC-based parcel boundaries and the boundary between V1 and V2 areas. Cyan arrows indicate RSFC-based parcel boundaries that may represent distinctions between foveal and peripheral representations in the visual field.
Figure 3
Figure 3
RSFC-based parcellation corresponds with task activations. A) Parcellation boundaries overlaid on an example task contrast from the motion discrimination task. B) The average fraction of task-activated vertices that fall within parcels across all 27 task contrasts by t-stat threshold. Expected fraction by chance of task-activated vertices falling within parcel boundaries is 0.696 (dotted line). C) Each colored dot represents the fraction of task-activated vertices that fall within parcel boundaries for each task at a single t-statistic threshold (t=2.3) compared to a null model. The null distribution reflects task/parcel area overlap from rotated real parcel boundaries (black dots). Gray bar indicates real parcellation showed significantly more overlap with task-activated vertices than null parcellations (p<0.05).
Figure 4
Figure 4
Convergence of resting state correlation estimates requires significant amounts of data. A) Example parcel correlation matrices computed from each half of the data. The parcels are sorted by system with black lines indicating system boundaries (see Figure S1 for system assignments). B) Pearson correlation (rM) of parcel-based correlation matrix from one half of the data with the correlation matrix generated from increasing amounts of data drawn from the other half. Represented are the mean (solid line) and standard deviation (dotted lines) of this correlation from 1000 random samplings of 84 sessions. C) Correlation when the same amount of time is drawn from a larger number of sessions, e.g. 18 minutes drawn from 4.5 minutes of 4 sessions (point on red line) is compared to 18 minutes drawn from 9 minutes of 2 sessions (point on black line).
Figure 5
Figure 5
Across-session compared to across-subject variability in resting state correlations. A) Above, parcel-to-parcel correlation standard deviation across sessions based on the individual subject parcellation and system assignment (see Figure S1). Below, the average correlation standard deviation for each parcel across all of its connections. B) Above, parcel-to-parcel correlation standard deviation across subjects using the group parcellation and system assignment reported in (Gordon et al., 2014b). Below, the average correlation standard deviation for each parcel across all of its connections.
Figure 6
Figure 6
Primary subject Infomap-based community detection produces resting state community topology similar to a 120-subject group average dataset. The maps depicted here represent a single view of community identity collapsed across multiple edge density thresholds (additional edge densities are found in Figure S5). Magenta circles highlight similarities between the individual and the group in the fronto-parietal system. Orange arrows point to the lateral somato-motor system present in the group but not the individual, while olive arrows point to the primary visual system present in the individual but not the group.
Figure 7
Figure 7
Example of idiosyncratic patterns of functional connectivity in an individual. Two nearby regions of interest (white spheres) in the lateral frontal cortex have the same system identity in the group (fronto-parietal) but different system identities in the individual (cingulo-opercular and fronto-parietal). Above, correlation maps from these two regions have very similar patterns in the group, with the largest differences occurring locally. Below, The same two regions demonstrate starkly different correlation patterns in the individual, with large regions of cortex showing large differences in correlation.

Comment in

References

    1. Anderson JS, Ferguson MA, Lopez-Larson M, Yurgelun-Todd D. Reproducibility of single-subject functional connectivity measurements. AJNR Am J Neuroradiol. 2011;32(3):548–555. - PMC - PubMed
    1. Birn RM, Molloy EK, Patriat R, Parker T, Meier TB, Kirk GR, Nair VA, Meyerand ME, Prabhakaran V. The effect of scan length on the reliability of resting-state fMRI connectivity estimates. Neuroimage. 2013;83:550–558. - PMC - PubMed
    1. Biswal B, Yetkin FZ, Haughton VM, Hyde JS. Functional connectivity in the motor cortex of resting human brain using echo-planar MRI. Magn Reson Med. 1995;34(4):537–541. - PubMed
    1. Blumensath T, Jbabdi S, Glasser MF, Van Essen DC, Ugurbil K, Behrens TE, Smith SM. Spatially constrained hierarchical parcellation of the brain with resting-state fMRI. Neuroimage. 2013;76:313–324. - PMC - PubMed
    1. Bourgeois FL, JC An extension of the Munkres algorithm for the assignment problem to rectangular matrices. Communications of the Association for Computing Machinery. 1971;14(12):802–804.

Publication types