. 2015 Aug 17;25(16):2075-89.
doi: 10.1016/j.cub.2015.06.052. Epub 2015 Jul 23.

Distinct Neural Circuits Control Rhythm Inhibition and Spitting by the Myogenic Pharynx of C. elegans

Affiliations

Distinct Neural Circuits Control Rhythm Inhibition and Spitting by the Myogenic Pharynx of C. elegans

Nikhil Bhatla et al. Curr Biol. .

Abstract

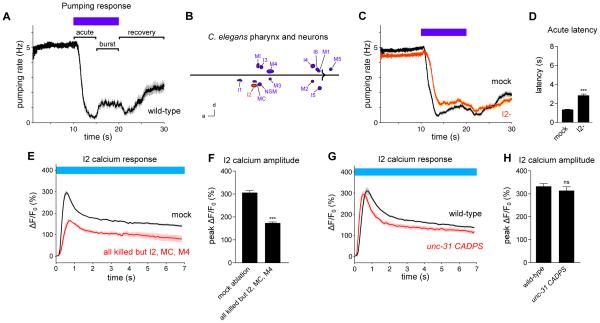
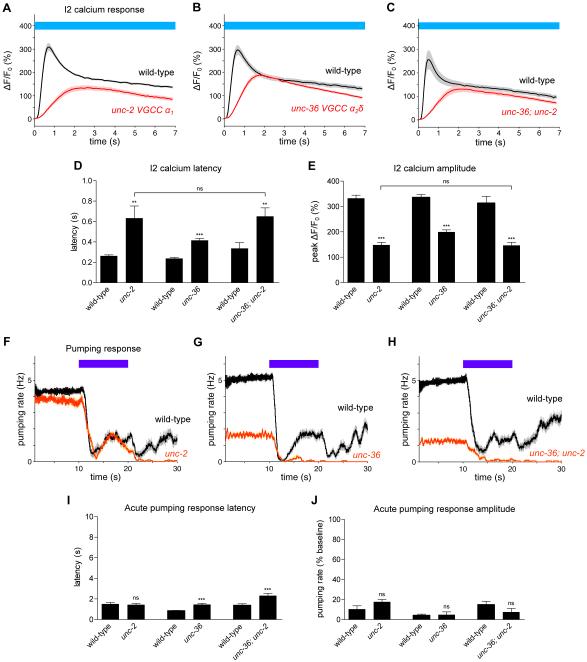
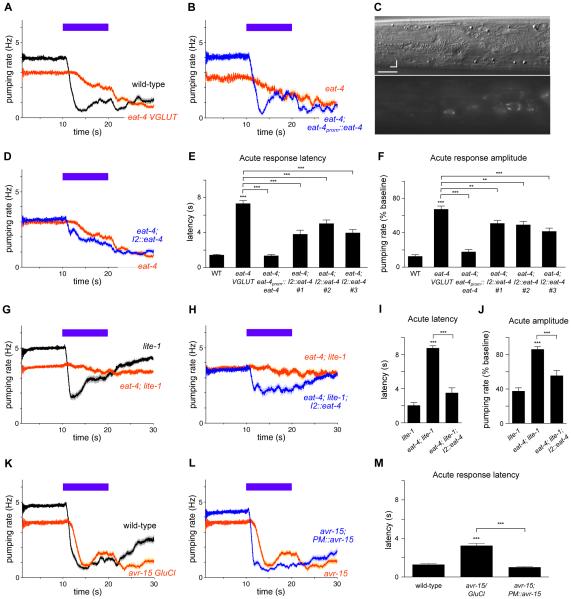
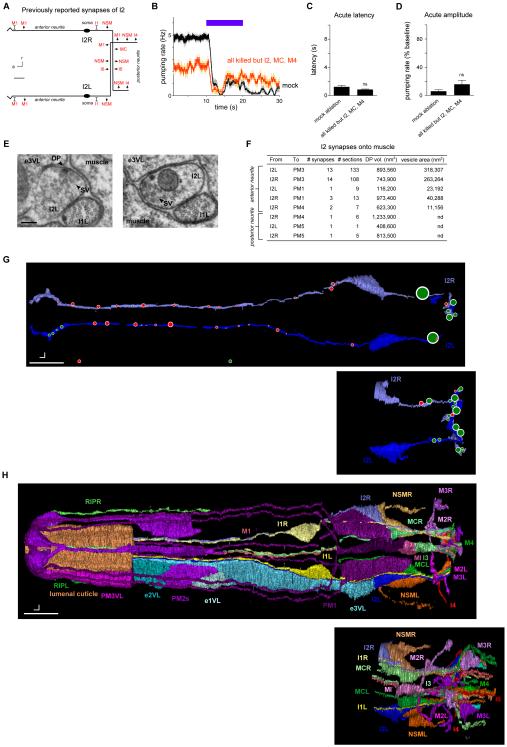
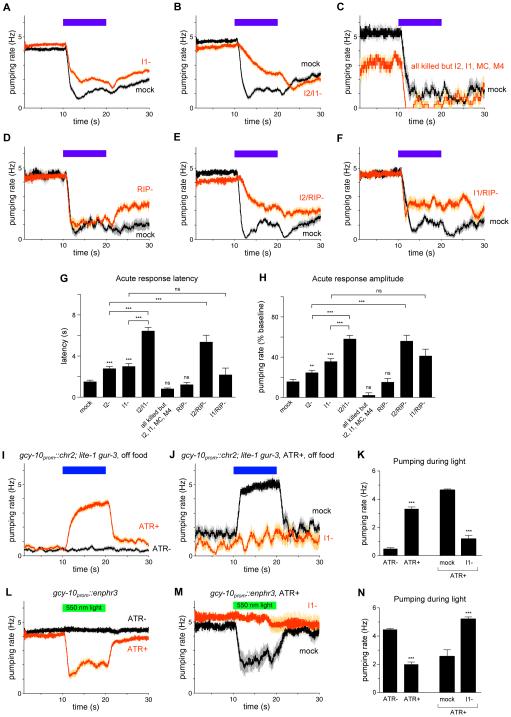
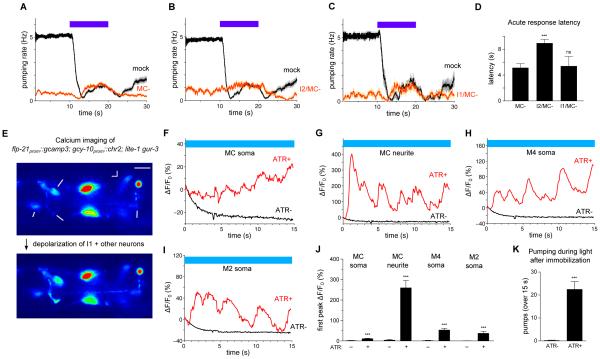
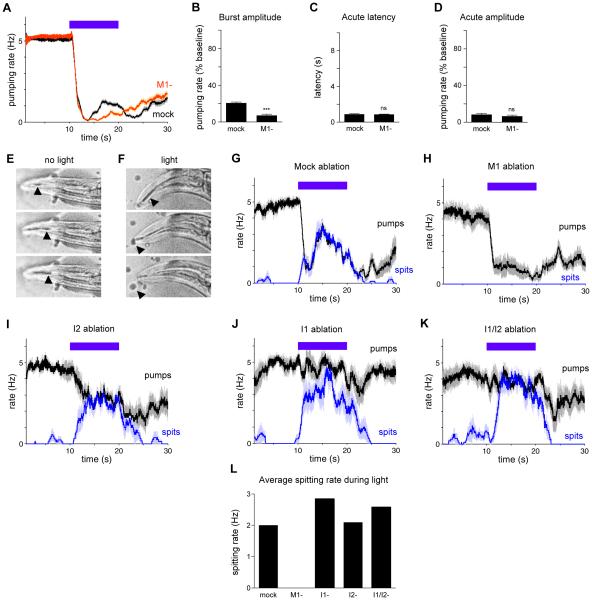
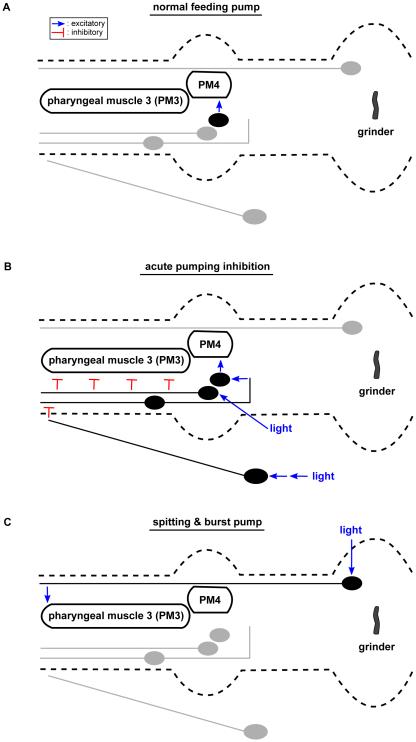
Neural circuits have long been known to modulate myogenic muscles such as the heart, yet a mechanistic understanding at the cellular and molecular levels remains limited. We studied how light inhibits pumping of the Caenorhabditis elegans pharynx, a myogenic muscular pump for feeding, and found three neural circuits that alter pumping. First, light inhibits pumping via the I2 neuron monosynaptic circuit. Our electron microscopic reconstruction of the anterior pharynx revealed evidence for synapses from I2 onto muscle that were missing from the published connectome, and we show that these "missed synapses" are likely functional. Second, light inhibits pumping through the RIP-I1-MC neuron polysynaptic circuit, in which an inhibitory signal is likely transmitted from outside the pharynx into the pharynx in a manner analogous to how the mammalian autonomic nervous system controls the heart. Third, light causes a novel pharyngeal behavior, reversal of flow or "spitting," which is induced by the M1 neuron. These three neural circuits show that neurons can control a myogenic muscle organ not only by changing the contraction rate but also by altering the functional consequences of the contraction itself, transforming swallowing into spitting. Our observations also illustrate why connectome builders and users should be cognizant that functional synaptic connections might exist despite the absence of a declared synapse in the connectome.


Figures

Figure 1
Figure 1. The I2 pharyngeal neurons can function as sensory neurons
(A) Pumping response to 436 nm (13 mW/mm2) light, with the acute, burst and recovery responses labeled. This result was previously described [16]. n = 20 worms. For all legends, if the number of trials is unspecified, each worm or cell was assayed once. (B) Map of pharyngeal neuron nuclei; 14 of the 20 total neurons are shown, as neurons that are members of a pair are depicted as a single neuron. I2 is highlighted in red. d = dorsal, a = anterior. Scale bar = 15 μm. (C) I2 ablation caused a defect in the acute response to light. n = 72 trials, 32 worms. Reproduced from [16]. (D) Quantification of acute response latency. Reproduced from [16]. (E) I2 responds to light in worms in which all pharyngeal neurons except I2, MC and M4 have been ablated with a laser. n = 3 neurons. (F) Quantification of the peak calcium response in I2. (G) unc-31(u280) CADPS mutants, which are defective in humoral signaling, exhibit an I2 calcium response similar to that of the wild type. n = 22 neurons. (H) Quantification of the peak calcium response in I2. Calcium response was measured in the posterior neurite of I2. Error bars and shading around traces indicate s.e.m. *** p < 0.001, ns = not significant at p < 0.05, t-test compared to mock-ablated control or wild-type. See also Figure S1.
Figure 2
Figure 2. The UNC-2 and UNC-36 voltage-gated calcium channels are partially required for the calcium response of I2
(A) unc-2(e55) mutants were partially defective in the calcium response of I2. n = 19 neurons. (B) unc-36(e251) mutants were partially defective in the calcium response of I2. n = 19. (C) unc-36; unc-2 mutants were not enhanced over the single mutants in their defects in the calcium response of I2. n = 21. (D) Quantification of calcium response latency. (E) Quantification of the peak calcium response. (F) unc-2 mutants showed a normal acute pumping response to light. n = 20 worms. (G) unc-36 mutants showed a small but significant defect in acute response latency. n = 20. (H) unc-36; unc-2 double mutants showed a small but significant defect in acute response latency. n = 20. (I) Quantification of acute response latency, briefly defined as the time between light onset and the first missed pump. (J) Quantification of acute response amplitude, briefly defined as the minimum of the pumping rates soon after light onset normalized to the pre-light pumping rate. Calcium response was measured in the posterior neurite of I2. Error bars and shading around traces indicate s.e.m. *** p < 0.001, ** p < 0.01, ns = not significant at p < 0.05, t-test compared to corresponding wild-type or indicated strain. See also Figure S2.
Figure 3
Figure 3. The I2 neurons secrete glutamate to rapidly block muscle contraction
(A) Mutants of eat-4(ky5) VGLUT were defective in the acute response to light. n = 60 worms. (B) Expression of genomic eat-4(njEx378) completely rescued the defective acute response of eat-4 mutants. n = 20. (C) Top: Nomarski differential interference contrast optics (DIC) image of an L4 worm head. Bottom: Expression pattern of eat-4 as indicated by a transgene carrying njEx378[eat-4prom::eat-4::gfp]. Expression was observed in I2 but not in the NSM neuron. Scale bar = 7 μm. d = dorsal, a = anterior. (D) I2-specific expression of the wild type eat-4 gene (flp-15prom::eat-4 cDNA::gfp) in eat-4 mutants partially restored the acute response to light. Three independent eat-4 strains carrying transgenes showed a quantitative improvement in the acute response (see (E) and (F)). The trace from strain #1 is shown. n = 55. (E) Quantification of acute response latency. (F) Quantification of acute response amplitude. (E-F) # indicates independently integrated transgenic strains. n = 55-60. (G) eat-4(ky5); lite-1(ce314) double mutants were nearly completely defective in the pumping response to light. The lite-1(ce314) trace includes data previously published [16]. n = 80. (H) I2-specific expression of the wild type eat-4 gene in eat-4; lite-1 double mutants partially restored the acute pumping response to light. n = 40. (I) Quantification of acute response latency. (J) Quantification of acute response amplitude. (K) avr-15(ad1051) glutamate-gated chloride channel (GluCl) mutants had a delayed pumping response to light. n = 60. (L) Pharyngeal muscle (PM)-specific expression of the wild-type avr-15 gene (myo-2prom::avr-15A cDNA) in avr-15 mutants restored normal acute response latency. n = 60. (M) Quantification of acute response latency. Error bars and shading around traces indicate s.e.m. *** p < 0.001, ** p < 0.001, t-test compared to wild-type, lite-1 or indicated strain. See also Figures S3-S5.
Figure 4
Figure 4. The I2 neurons synapse directly onto pharyngeal muscle
(A) Schematic of I2 synapses previously identified [7]. a = anterior, r = right, scale bar = 6 μm. Arrows indicate chemical synapses, barred lines indicate gap junctions. (B) Laser ablation of all pharyngeal neurons except I2, MC and M4 did not affect acute response latency. n = 6 trials, 2 worms. (C) Quantification of acute response latency. (D) Quantification of acute response amplitude. (E) Electron micrographs of two synapses from the anterior neurite of I2L (the left I2 neuron) to pharyngeal muscle. These synapses are dyadic and oppose an epithelial cell (e3VL) as well as muscle (PM3). The left panel displays a synapse with both a dense projection and vesicles, while the right panel displays a synapses with only vesicles. DP = dense projection; SV = synaptic vesicles. Scale bar = 100 nm. (F) Table showing measurements for synapses identified between I2 and pharyngeal muscle (PM). The listed dense projection (DP) volumes and vesicle areas are the sum of these values across all synapses with the specific partners indicated by the row in the table. (G) Morphological reconstruction of parts of four I2 neurons in two worms. The I2 neurons in worm #1 were completely reconstructed except in the posterior nerve ring, which was lost. This missing area was reconstructed in worm 4, as well as the entire posterior neurite. Red circles indicate synapses onto muscle (including dyadic synapses in which muscle is one of the partners), and green circles indicate synapses onto neurons and occasionally onto epithelial cells. Circles are scaled to synapse size, as defined by the sum of the dense projection volume and synaptic vesicle volume. Dorsal view. Scale bar = 5 μm. (H) Morphological reconstruction of the anterior half of the pharynx, including part of the extrapharyngeal RIP neurites. Ventral left (VL) epithelial cells and pharyngeal muscles are shown; only part of pharyngeal muscle 3 (PM3) and the lumenal cuticle are shown. Gland cells, marginal cells, and pharyngeal muscles 4 and 5 are not shown. Dorsal view. Scale bar = 5 μm. Error bars and shading around traces indicate s.e.m. nd = not determined. ns = not significant at p < 0.05, t-test compared to mock control. See also Figure S6 for electron micrographs and quantification of all observed I2 synapses.
Figure 5
Figure 5. The I1 and RIP interneurons likely constitute a neural pathway that controls acute inhibition in parallel to I2
(A) I1 ablation caused a defect in the acute response to light. n = 138 trials, 74 worms. (B) I2/I1 double ablation enhanced the acute response defects caused by either single ablation. n = 75 trials, 25 worms. (C) Laser ablation of all pharyngeal neurons except I2, I1, MC and M4 did not affect the acute response. n = 4 trials, 4 worms. (D) RIP ablation did not affect the acute response. n = 21 trials, 6 worms. (E) I2/RIP double ablation enhanced the acute response defect of I2 ablation. n = 26 trials, 9 worms. (F) I1/RIP double ablation did not enhance the acute response defect of I1 ablation. n = 18 trials, 6 worms. (G) Quantification of acute response latency. (H) Quantification of acute response amplitude. (I) Optogenetic depolarization of gcy-10prom::chr2; lite-1 gur-3 worms caused an increase in pumping rate off of food in the presence of all-transretinal (ATR+) but not in its absence (ATR−). n = 50 worms. (J) Optogenetic depolarization of gcy-10prom::chr2; lite-1 gur-3 worms failed to induce pumping after laser ablation of I1, indicating that the optogenetic effect requires I1. n = 9 trials, 8 worms. (K) Quantification of the average pumping rate during 10 s of optogenetic depolarization. (L) Optogenetic hyperpolarization of gcy-10prom::enphr3 worms caused a decrease in pumping rate on food in the presence of ATR (ATR+) but not in its absence (ATR−). n = 47 worms. (M) Optogenetic hyperpolarization of gcy-10prom::enphr3 worms failed to inhibit pumping after laser ablation of I1, indicating that the optogenetic effect requires I1. n = 11 worms. (N) Quantification of the average pumping rate during 10 s of optogenetic hyperpolarization. Error bars and shading around traces indicate s.e.m. *** p < 0.001, ** p < 0.01, ns = not significant at p < 0.05, t-test compared to wild-type or as indicated. See also Figure S7.
Figure 6
Figure 6. The MC neurons likely act in the same neural pathway as I1 and in parallel to I2
(A) MC-ablated worms displayed a modest acute response. n = 49 trials, 20 worms. (B) I2/MC double ablation caused a severe acute response defect. n = 17 trials, 11 worms. (C) I1/MC double ablation did not cause a severe acute response defect. n = 9 trials, 9 worms. (D) Quantification of acute response latency. Comparison with mock-ablated animals was not done because of the substantial difference in baseline pumping rate. (E) An example of calcium responses observed in the MC soma, MC neurite, M4 soma and M2 soma (flp-21prom::gcamp3) in response to ChR2 depolarization of I1 and other gcy-10-expressing neurons in a lite-1 gur-3 mutant. Scale bar = 10 μm. (F) Quantification of the calcium response of the MC soma shown in (E). (G) Quantification of the calcium response of the MC neurite shown in (E). (H) Quantification of the calcium response of the M4 soma shown in (E). (I) Quantification of the calcium response of the M2 soma shown in (E). (J) Quantification of the amplitude of the first calcium spike observed in each labeled compartment in response to ChR2 depolarization of I1 and other gcy-10-expressing neurons in lite-1 gur-3 mutants. n ≥ 13 worms. (K) ChR2 depolarization of I1 and other gcy-10-expressing neurons caused pumping in immobilized lite-1 gur-3 worms. n ≥ 17 worms. (J, K) Data were pooled across two independent transgene integrands (nIs551 and nIs552). Error bars and shading around traces indicate s.e.m. *** p < 0.001, ** p < 0.01, ns = not significant at p < 0.05; t-test compared double ablations to MC single ablation; Mann-Whitney test compared ATR− to ATR+. See also Movie S1.
Figure 7
Figure 7. The M1 motor neuron promotes spitting
(A) M1 ablation diminished the burst response while leaving the acute response intact. n = 74 trials, 31 worms. (B) Quantification of burst response amplitude. (C) Quantification of acute response latency. (D) Quantification of acute response amplitude. (E) Image sequence showing one normal feeding pump before the worm was illuminated with light. The black arrow indicates oil that was present before the pump began, and the white arrow indicates oil that was sucked in from the environment during the pump. After completion of the pump, oil was retained in the pharynx. (F) Image sequence showing one spitting pump that occurred during illumination with light. The black arrow indicates oil that was present before the pump began that is expelled from the pharynx after completion of the pump. (G) For mock-ablated worms, pumps during light exposure correspond to spitting, as assayed with micron-sized beads. A "spit" was scored if beads were either released from the corpus into the environment or beads ingested during corpus contraction were not retained after corpus relaxation. n = 13 worms. (H) For M1-ablated worms, pumping is reduced during light exposure relative to mock ablation and no spitting occurs. n = 13. (I) For I2-ablated worms, pumping is increased relative to mock ablation and spitting still occurs. n = 9. (J) For I1-ablated worms, pumping is increased during light exposure relative to mock ablation and spitting still occurs. n = 11. (K) For I1/I2 double-ablated worms, pumping is increased during light exposure relative to mock ablation and spitting still occurs. n = 10. (L) Quantification of average spitting rate during light exposure. (G-L) Assays done with micron-sized beads. Error bars and shading around traces indicate s.e.m. *** p < 0.001, ns = not significant at p < 0.05, t-test compared to mock control. See also Movie S2.
Figure 8
Figure 8. Neural circuit control of rhythm inhibition and spitting by the myogenic pharynx
An expanded view of the pharynx with neurons and neurites depicted in their anatomical locations. Blue lines indicate functional activation and red lines indicate functional inhibition. For each behavior, active neurons and neurites are in black and inactive neurons and neurites are in grey. The acute inhibition pathways are anatomically bilaterally symmetric; only one side is shown. (A) During a normal feeding pump that occurs in the absence of shortwave light, the MC motor neurons drive muscle contractions via direct synapses onto pharyngeal muscle 4 (PM4) and marginal cells (not shown). (B) When the worm is exposed to light, pumping is acutely inhibited via two pathways. In the first, intrinsic pathway, light directly activates the I2 sensorimotor neurons to directly inhibit pharyngeal muscle 3 (PM3). In the second, extrinsic pathway, light is detected outside the pharynx and its signal is propagated via the non-pharyngeal RIP interneurons and the pharyngeal I1 interneurons to block MC function. The double arrow from light to RIP indicates that additional neurons are likely to sense light and relay the signal to RIP. (C) When the worm is exposed to prolonged periods of light, pumping increases (the burst response) and spitting occurs via a neural pathway requiring the M1 motor neuron. We speculate that M1 is directly activated by light, because M1 expresses the light-sensitive gustatory receptor LITE-1 [16].

Comment in

References

    1. Irisawa H, Brown HF, Giles W. Cardiac pacemaking in the sinoatrial node. Physiological Reviews. 1993;73:197–227. - PubMed
    1. Donnelly G, Jackson TD, Ambrous K, Ye J, Safdar A, Farraway L, Huizinga JD. The myogenic component in distention-induced peristalsis in the guinea pig small intestine. American Journal of Physiology - Gastrointestinal and Liver Physiology. 2001;280:G491–G500. - PubMed
    1. Palma J-A, Benarroch EE. Neural control of the heart. Neurology. 2014;83:1–11. - PubMed
    1. Chalfie M, Sulston JE, White JG, Southgate E, Thomson JN, Brenner S. The neural circuit for touch sensitivity in Caenorhabditis elegans. The Journal of Neuroscience. 1985;5:956–964. - PMC - PubMed
    1. Chalasani SH, Chronis N, Tsunozaki M, Gray JM, Ramot D, Goodman MB, Bargmann CI. Dissecting a circuit for olfactory behavior in Caenorhabditis elegans. Nature. 2007;450:63–70. - PubMed

Publication types

LinkOut - more resources