

Disparities in Disability Life Expectancy in US Birth Cohorts: The Influence of Sex and Race
- PMID: 26213420
- PMCID: PMC4510977
- DOI: 10.1080/19485565.2006.9989124
Disparities in Disability Life Expectancy in US Birth Cohorts: The Influence of Sex and Race
Abstract
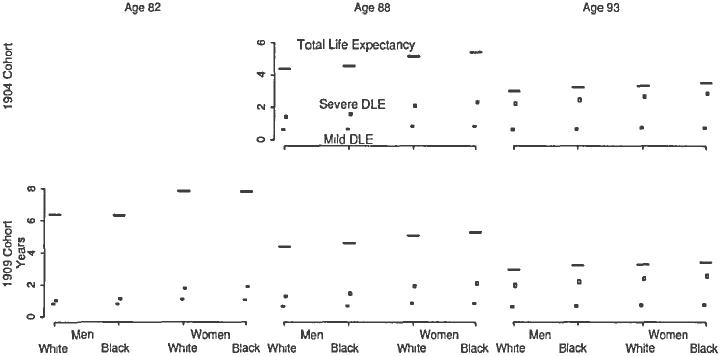
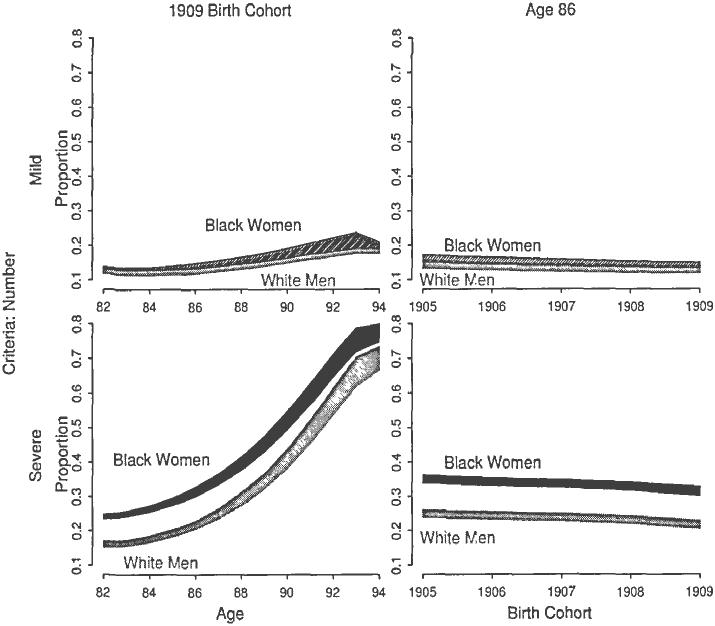
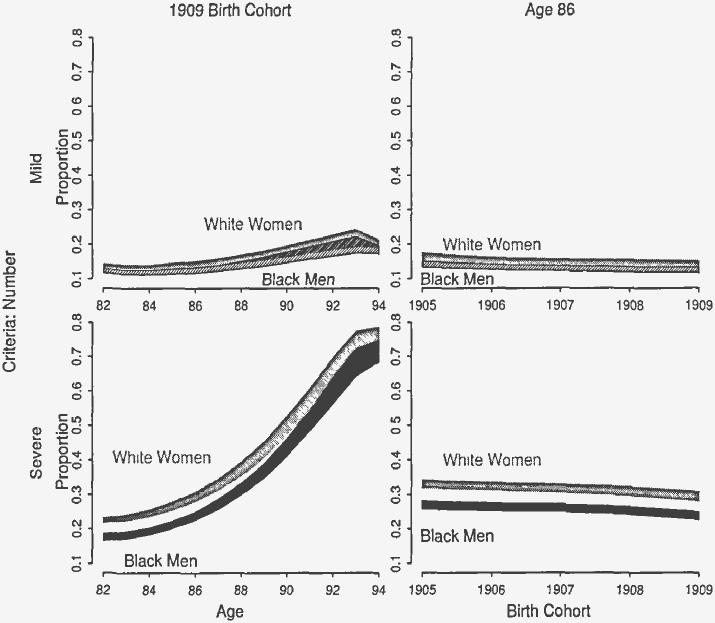
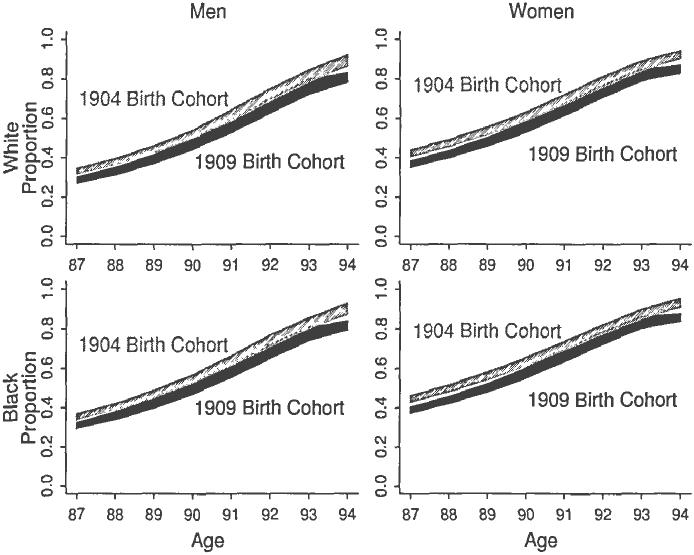
Racial and sex disparities in chronic diseases and mortality are sources of health inequality and have been observed from infancy to adulthood. Disparities in health and mortality contribute to corresponding disparities in healthy life. I address two previously unanswered questions in the aging literature. First, does the racial and sex gap in healthy life narrow, persist, or expand over age and time, particularly considering severity of ill health, among the oldest old? Second, do some race-sex groups of birth cohorts live not just longer lives, but longer healthier lives, while others spend additional years in illness? To estimate the quantities, I employ a refined definition of physical disability and apply a new extension of Sullivan's method to true birth cohorts. The results suggest among the oldest old, few racial or sex disparities exist over age and time in mild disability. Yet, racial and sex disparities persist over age and time in severe disability.
Figures
Similar articles
-
On the Estimation of Disability-Free Life Expectancy: Sullivan' Method and Its Extension.J Am Stat Assoc. 2007 Fall;102(480):1199-1211. doi: 10.1198/016214507000000040. J Am Stat Assoc. 2007. PMID: 26279593 Free PMC article.
-
Are China's oldest-old living longer with less disability? A longitudinal modeling analysis of birth cohorts born 10 years apart.BMC Med. 2019 Feb 1;17(1):23. doi: 10.1186/s12916-019-1259-z. BMC Med. 2019. PMID: 30704529 Free PMC article.
-
Life expectancy by county, race, and ethnicity in the USA, 2000-19: a systematic analysis of health disparities.Lancet. 2022 Jul 2;400(10345):25-38. doi: 10.1016/S0140-6736(22)00876-5. Epub 2022 Jun 16. Lancet. 2022. PMID: 35717994 Free PMC article.
-
Racial Disparities in ICU Outcomes: A Systematic Review.Crit Care Med. 2022 Jan 1;50(1):1-20. doi: 10.1097/CCM.0000000000005269. Crit Care Med. 2022. PMID: 34636803
-
Approaches to Studying Determinants of Racial-Ethnic Disparities in Stroke and Its Sequelae.Stroke. 2020 Nov;51(11):3406-3416. doi: 10.1161/STROKEAHA.120.030424. Epub 2020 Oct 26. Stroke. 2020. PMID: 33104476 Free PMC article. Review.
Cited by
-
Past, Present, and Future of Healthy Life Expectancy.Cold Spring Harb Perspect Med. 2015 Nov 2;5(11):a025957. doi: 10.1101/cshperspect.a025957. Cold Spring Harb Perspect Med. 2015. PMID: 26525456 Free PMC article. Review.
-
Disability and morbidity among US birth cohorts, 1998-2018: A multidimensional test of dynamic equilibrium theory.SSM Popul Health. 2023 Oct 4;24:101528. doi: 10.1016/j.ssmph.2023.101528. eCollection 2023 Dec. SSM Popul Health. 2023. PMID: 37927816 Free PMC article.
-
Inter-cohort shifts in chronic disease, dementia, and mortality.Biodemography Soc Biol. 2024 Oct-Dec;69(4):203-217. doi: 10.1080/19485565.2024.2419518. Epub 2024 Nov 14. Biodemography Soc Biol. 2024. PMID: 39541238 Free PMC article.
References
-
- Anderson J, Felson D. Factors associated with osteoarthritis of the knee in the first National Health and Nutrition Examination Survey (HANES I) American Journal of Epidemiology. 1988;128:179–189. - PubMed
-
- Arbeev K, Butov A, Manton K, Sannikov I, Yashin A. Disability trends in gender and race groups of early retirement ages in the USA. Sozial-Und Praventivmedizen. 2004;49:142–151. - PubMed
-
- Arias E. United States life table, 2003. 2006;54:14. National Vital Statistics Reports. - PubMed
-
- Beran R. Balanced simultaneous confidence sets. Journal of the American Statistical Association. 1988;83:679–686.
-
- Bongaarts J, Feeny G. How long do we live? Population and Development Review. 2002;28:13–29.
Grants and funding
LinkOut - more resources
Full Text Sources
Miscellaneous