. 2015 Jan-Mar;5(1):011016.
doi: 10.1103/PhysRevX.5.011016.

Quantifying selective pressures driving bacterial evolution using lineage analysis

Affiliations

Quantifying selective pressures driving bacterial evolution using lineage analysis

Guillaume Lambert et al. Phys Rev X. 2015 Jan-Mar.

Abstract

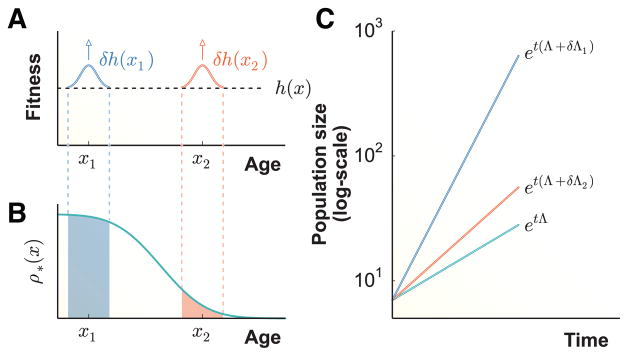
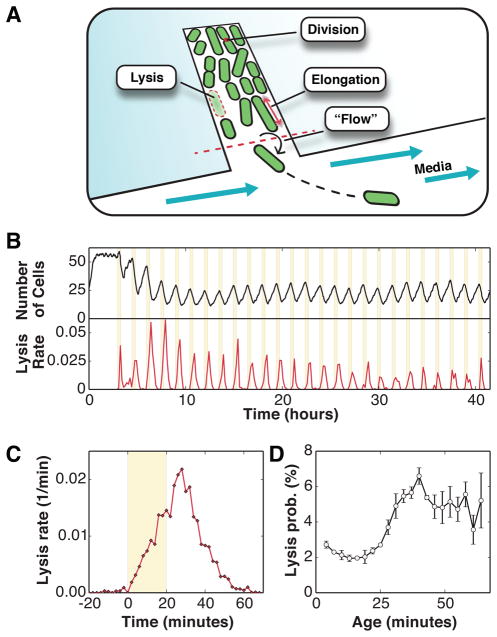
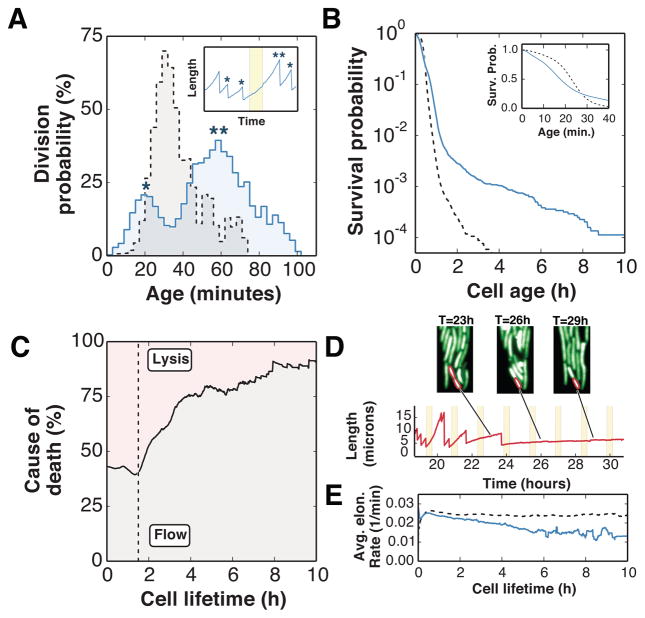
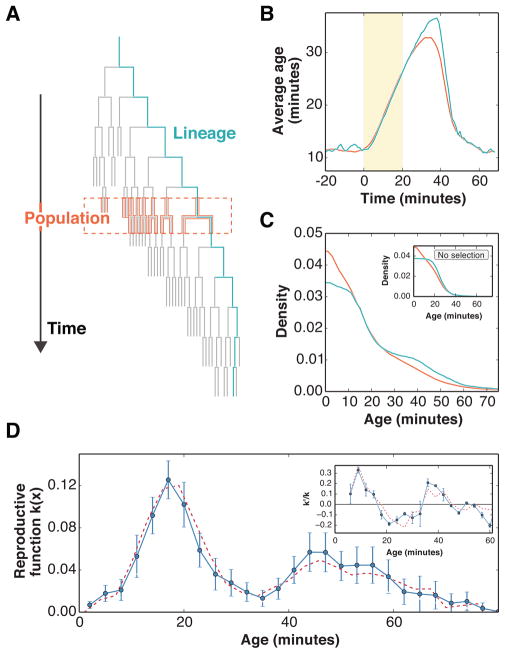
Organisms use a variety of strategies to adapt to their environments and maximize long-term growth potential, but quantitative characterization of the benefits conferred by the use of such strategies, as well as their impact on the whole population's rate of growth, remains challenging. Here, we use a path-integral framework that describes how selection acts on lineages -i.e. the life-histories of individuals and their ancestors- to demonstrate that lineage-based measurements can be used to quantify the selective pressures acting on a population. We apply this analysis to E. coli bacteria exposed to cyclical treatments of carbenicillin, an antibiotic that interferes with cell-wall synthesis and affects cells in an age-dependent manner. While the extensive characterization of the life-history of thousands of cells is necessary to accurately extract the age-dependent selective pressures caused by carbenicillin, the same measurement can be recapitulated using lineage-based statistics of a single surviving cell. Population-wide evolutionary pressures can be extracted from the properties of the surviving lineages within a population, providing an alternative and efficient procedure to quantify the evolutionary forces acting on a population. Importantly, this approach is not limited to age-dependent selection, and the framework can be generalized to detect signatures of other trait-specific selection using lineage-based measurements. Our results establish a powerful way to study the evolutionary dynamics of life under selection, and may be broadly useful in elucidating selective pressures driving the emergence of antibiotic resistance and the evolution of survival strategies in biological systems.


Figures

FIG. 1
FIG. 1
Strength of selection on life-history traits and the optimal lineage relation. a) A behavioral change (e.g. a mutation, an epigenetic modification, or a different survival strategy) causes a small increase in a life-history trait δh(xi) for cells at age xi. b) At steady-state growth after sufficiently long time, a population is dominated by cells whose ancestral lineage has an optimal age distribution ρ*(x). The distribution ρ* determines what portion of lineages benefit from the small boosts in fitness at ages x1 and x2. c) The change in growth rate δΛ resulting from the boost in fitness at age xi is precisely equal to δh · ρ* evaluated at xi. In this example, the change in growth rate is larger at age x1 because it affects a larger fraction of the population’s lineage history.
FIG. 2
FIG. 2
Lytic response to carbenicillin antibiotics. a) Schematic representation of the microfluidics device, where cells confined to growth chambers are monitored for hundreds of generations. b) The number of cells decreases sharply following each 100 ug/mL carbenicillin treatment. The measured lysis rate is also in phase with the antibiotic treatments. c) Average lysis rate in response to each 20-minutes treatment of carbenicillin (number of treatments = 25). The lysis rate peaks approximately 10 minutes after antibiotic removal. d) The rate of cell lysis increases with cell age (mean ± std. dev., n = 3 minutes).
FIG. 3
FIG. 3
Age-dependent growth and survival functions. a) The age-dependent division probability obtained from life-history measurements of a population under cyclical carbenicillin treatments (q(x), blue line) differs from a population grown under constant conditions (dashed line). Inset: the bimodal distribution of q(x) is caused by the carbenicillin-dependent division rate, where cellular divisions are avoided during carbenicillin treatments. b) Graph of the survival function ℓ(x) under carbenicillin treatments (blue line) as a function of the cell age. A non-negligible fraction of persister cells survive more than 2h under carbenicillin treatments compared with a population grown in the absence of selection (dashed lines). Inset: Carbenicillin treatments decrease the survival probability for ages ≤ 28 minutes (blue line) compared to an untreated population (dashed line). c) The fraction of cellular deaths caused by lysis decreases once cells survive a single carbenicillin treatment cycle (dashed line at t = 90 minutes). d) An example of a persister cell which survives multiple antibiotic treatments, but fails to revert to a proliferative state. e) The average elongation rate decreases with increasing cell lifetime for cells under cyclical carbenicillin treatments (blue line) but remains constant for the untreated population (dashed line).
FIG. 4
FIG. 4
Lineage distribution and selection. a) Diagram illustrating lineage (teal) and population (orange) measurements. b) The average age of the surviving lineage is lower than that of the population average during each treatment cycle, suggesting that the surviving lineage, on average, goes through a lower number of divisions. c) The age-distribution of population is underrepresented for ages between 25 and 50 minutes and enriched with younger cells. The different distributions reflect the age-dependent rate of lysis, whose effect is to remove older cells from the population but not from the surviving lineage. Inset: Although there exists differences between the lineage and population age distributions for cell populations grown in the absence of selection (i.e. constant conditions), no enrichment for cells older than 25 minutes is observed in the lineage age distribution. d) Comparison between the two measurements of the reproduction function, obtained using direct life-history measurements (k(x)= b(x) ℓ(x), dashed line) or extracted from the surviving lineage age-distribution (ks(x) in Eq. 4, blue circles) are in very good agreement. Data is reported as the population average ± std. dev. (n = 18 populations). Inset: comparison between the rate of change of the reproduction function (κ(x) ≡ k′(x)/k(x)) obtained from the life-history and surviving lineage measurements (mean ± std. dev., n = 18 populations)

Similar articles

Cited by

References

    1. Darwin Charles. On the Origin of Species by Means of Natural Selection, Or, The Preservation of Favoured Races in the Struggle for Life. J. Murray; 1859. - PMC - PubMed
    1. Allen Orr H. The genetic theory of adaptation: a brief history. Nature Reviews Genetics. 2005;6(2):119–127. doi: 10.1038/nrg1523. - DOI - PubMed
    1. Schluter Dolph. Estimating the form of natural selection on a quantitative trait. Evolution. 2010;42(5):2510–2520. doi: 10.2307/2408904. - DOI - PubMed
    1. Shaw Ruth G, Geyer Charles J. Inferring fitness landscapes. Evolution. 2010;64(9):2510–2520. doi: 10.1111/j.1558-5646.2010.01010.x. - DOI - PubMed
    1. Elena Santiago F, Lenski Richard E. Evolution experiments with microorganisms: the dynamics and genetic bases of adaptation. Nature Reviews Genetics. 2003;4(6):457–469. doi: 10.1038/nrg1088. - DOI - PubMed

LinkOut - more resources